Showing posts with label performance. Show all posts

Monday, July 1, 2013

DB CPU Greater Than DB Time

According to Oracle documentation DB CPU is a child of DB Time. The document says that parent child relationship of these values is for containment only and child may not add up to the parent. But can the opposite happen? Child values exceed the parent value?
That's what has been happening on several 11gR2 Standard Edition RACs. (with PSU 11.2.0.3.4 and 11.2.0.3.5 applied). The statspack reports shows DB CPU greater than DB Time.
Example 1: 
Time Model System Stats  DB/Inst: GRAVEL/gravel1  Snaps: 1735-1746
-> Ordered by % of DB time desc, Statistic name

Statistic                                       Time (s) % DB time
----------------------------------- -------------------- ---------
DB CPU                                              72.3     116.3
sql execute elapsed time                            30.4      48.9
connection management call elapsed                   7.7      12.4
parse time elapsed                                   1.5       2.4
PL/SQL execution elapsed time                        0.8       1.3
hard parse elapsed time                              0.3        .5
hard parse (sharing criteria) elaps                  0.1        .1
sequence load elapsed time                           0.1        .1
hard parse (bind mismatch) elapsed                   0.0        .0
repeated bind elapsed time                           0.0        .0
DB time                                             62.2
background elapsed time                             81.7
background cpu time                                 21.9
          -------------------------------------------------------------

Example 2:
Time Model System Stats  DB/Inst: GRAVEL/gravel1  Snaps: 1969-1970
-> Ordered by % of DB time desc, Statistic name

Statistic                                       Time (s) % DB time
----------------------------------- -------------------- ---------
DB CPU                                             109.3     104.6
sql execute elapsed time                            58.5      56.0
connection management call elapsed                   7.3       7.0
parse time elapsed                                   3.8       3.6
PL/SQL execution elapsed time                        2.4       2.3
hard parse elapsed time                              1.3       1.2
hard parse (sharing criteria) elaps                  1.3       1.2
sequence load elapsed time                           0.2        .2
PL/SQL compilation elapsed time                      0.0        .0
repeated bind elapsed time                           0.0        .0
hard parse (bind mismatch) elapsed                   0.0        .0
DB time                                            104.5
background elapsed time                             95.3
background cpu time                                 26.2
          -------------------------------------------------------------
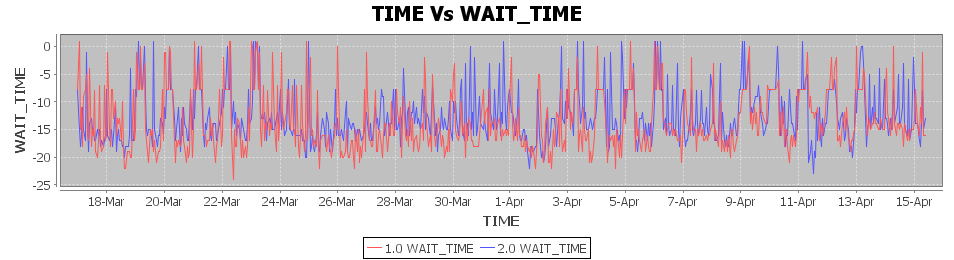
DB CPU exceeding DB Time has been happening intermittently for while. Following graphs show the different between DB CPU and DB Time and values below 0 indicate instances where DB CPU greater than DB Time.

After raising a SR Oracle has created "Bug 16300155 STATSPACK REPORTS SHOW DB CPU GREATER THAN DB TIME" and still investigating.


Similar observation was also made on a Enterprise Edition RAC as well.

This had been known to Oracle and already had a bug number (Bug 12713813: DB CPU LOOKS OVER-ESTIMATED) assigned to investigating this. However it was mentioned by Oracle that this bug hasn't been progressed because Oracle couldn't reproduce the issue. For the observed values it was said that DB Time is too little and to raise a SR (for awr related issue) if it's observed again at higher DB Times, although the Oracle engineer agreed that this an oddity and impossibility (that DB CPU is greater than DB Time no matter how small the observed values are).

Update 05 July 2013
AWR related SR was reopened as DB CPU higher than DB Time was observed during high activity time.


Update 18 July 2013
New bug has been created with regard to this issue. Bug 17181272 - AWR REPORTS DB CPU GREATER THAN DB TIME ON RAC DATABASE. Current status is development working.

Monday, January 7, 2013

Moving Stored Outlines From One Database To Another

Moving stored outlines from one database to another involves simply exporting the outline schema tables (outln.ol$,outln.ol$hints and outln.ol$nodes) from the source database to another. Since the outlines are global even if the user schema under which the outlines are created is not present in the destination database, any schema running the same sql in the destination database will use the store outline.(provided other outline related constraints are met. Refer 67536.1 and 132547.1) Stored outlines don't depend on the schema and once created all user schema running the same SQL could use the stored outline.
This post shows steps to transfer the earlier created outlines to a different database where the schema under which outlines were initially created is not present.
1. Export the current outlines
SQL> select owner,name from dba_outlines;

OWNER       NAME
----------- -------------
ASANGA      JDBC_OUTLINE
ASANGA      FULL_TABLE
Exporting with exp
exp system/std11g1db  file=outlns.dmp tables=\(outln.ol\$,outln.ol\$hints,outln.ol\$nodes\) statistics=none

Export: Release 11.1.0.7.0 - Production on Mon Jan 7 10:58:27 2013

Connected to: Oracle Database 11g Release 11.1.0.7.0 - 64bit Production
Export done in AL32UTF8 character set and AL16UTF16 NCHAR character set

About to export specified tables via Conventional Path ...
Current user changed to OUTLN
. . exporting table                            OL$          2 rows exported
. . exporting table                       OL$HINTS         20 rows exported
. . exporting table                       OL$NODES         26 rows exported
Export terminated successfully without warnings.
2. The stored outlines are owned by user asanga but this user is missing in the destination database
SQL> select username from dba_users order by 1;

USERNAME
------------------------------
ANONYMOUS
BEAR
DBSNMP
DIP
EXFSYS
ORACLE_OCM
OUTLN
PERFSTAT
SYS
SYSTEM
TSMSYS
WMSYS
XDB
XS$NULL
It's assumed that at the destination database the application schema is named "bear".
3. Copy the generated dump file to the destination and import it into the destination database.
imp system/racse11g1db file=outlns.dmp full=y ignore=y

Import: Release 11.1.0.7.0 - Production on Mon Jan 7 11:31:05 2013

Connected to: Oracle Database 11g Release 11.1.0.7.0 - 64bit Production
With the Real Application Clusters option

Export file created by EXPORT:V11.01.00 via conventional path
import done in US7ASCII character set and AL16UTF16 NCHAR character set
import server uses AL32UTF8 character set (possible charset conversion)
export client uses AL32UTF8 character set (possible charset conversion)
. importing SYSTEM's objects into SYSTEM
. importing OUTLN's objects into OUTLN
. . importing table                          "OL$"          2 rows imported
. . importing table                     "OL$HINTS"         20 rows imported
. . importing table                     "OL$NODES"         26 rows imported
Import terminated successfully without warnings.
4. Even though the user asanga is missing in the destination database, the stored outlines will be showed as owned by user asanga.
SQL> show user
USER is "SYS"

SQL> select  owner,name from dba_outlines;

OWNER    NAME
-------- --------------------
ASANGA   FULL_TABLE
ASANGA   JDBC_OUTLINE
and there will be no stored outlines under user_outlines views for user "bear".
SQL> conn bear/bear
Connected.
SQL> select name from user_outlines;

no rows selected
5. But if the same SQL is executed under the user bear schema the SQL will use the appropriate outline (it's assumed use stored outline is set).
SQL> select count(*) from big_table where p_id=1;

SQL> select * from table(dbms_xplan.display_cursor(null,null,'ALLSTATS OUTLINE'));
SQL_ID  80151fvm1d9af, child number 0
-------------------------------------
select count(*) from big_table where p_id=:"SYS_B_0"

Plan hash value: 599409829

-------------------------------------------------
| Id  | Operation          | Name      | E-Rows |
-------------------------------------------------
|   0 | SELECT STATEMENT   |           |        |
|   1 |  SORT AGGREGATE    |           |      1 |
|*  2 |   TABLE ACCESS FULL| BIG_TABLE |      2 |
-------------------------------------------------

Outline Data
-------------

  /*+
      BEGIN_OUTLINE_DATA
      IGNORE_OPTIM_EMBEDDED_HINTS
      OPTIMIZER_FEATURES_ENABLE('11.1.0.7')
      DB_VERSION('11.1.0.7')
      OPT_PARAM('_optimizer_extended_cursor_sharing' 'none')
      OPT_PARAM('_optimizer_extended_cursor_sharing_rel' 'none')
      OPT_PARAM('optimizer_index_cost_adj' 25)
      OPT_PARAM('optimizer_index_caching' 90)
      FIRST_ROWS(1000)
      OUTLINE_LEAF(@"SEL$1")
      FULL(@"SEL$1" "BIG_TABLE"@"SEL$1")
      END_OUTLINE_DATA
  */

Predicate Information (identified by operation id):
---------------------------------------------------

   2 - filter("P_ID"=:SYS_B_0)

Note
-----
   - outline "FULL_TABLE" used for this statement
   - Warning: basic plan statistics not available. These are only collected when:
       * hint 'gather_plan_statistics' is used for the statement or
       * parameter 'statistics_level' is set to 'ALL', at session or system level


6. User "bear" could be made to own the stored outline by creating a private outline and then refreshing the public outline with it.
SQL> create private outline myfulltable from full_table;
Outline created.

SQL> execute dbms_outln_edit.refresh_private_outline('MYFULLTABLE');
PL/SQL procedure successfully completed.

SQL> create or replace outline full_table from private MYFULLTABLE;
Outline created.
After this the full_table outline will appear when user_outline is queried in "bear" schema.
SQL> select name from user_outlines;

NAME
-----------
FULL_TABLE
Querying dba_outlines shows now the outline is owned by user "bear"
SQL> select owner,name from dba_outlines;

OWNER    NAME
-------- --------------------
ASANGA   JDBC_OUTLINE
BEAR     FULL_TABLE
7. Verify that stored outline is still used.
SQL> select count(*) from big_table where p_id=1;

SQL> select * from table(dbms_xplan.display_cursor(null,null,'ALLSTATS OUTLINE'));
SQL_ID  80151fvm1d9af, child number 0
-------------------------------------
select count(*) from big_table where p_id=:"SYS_B_0"

Plan hash value: 599409829

-------------------------------------------------
| Id  | Operation          | Name      | E-Rows |
-------------------------------------------------
|   0 | SELECT STATEMENT   |           |        |
|   1 |  SORT AGGREGATE    |           |      1 |
|*  2 |   TABLE ACCESS FULL| BIG_TABLE |      2 |
-------------------------------------------------

Outline Data
-------------

  /*+
      BEGIN_OUTLINE_DATA
      IGNORE_OPTIM_EMBEDDED_HINTS
      OPTIMIZER_FEATURES_ENABLE('11.1.0.7')
      DB_VERSION('11.1.0.7')
      OPT_PARAM('_optimizer_extended_cursor_sharing' 'none')
      OPT_PARAM('_optimizer_extended_cursor_sharing_rel' 'none')
      OPT_PARAM('optimizer_index_cost_adj' 25)
      OPT_PARAM('optimizer_index_caching' 90)
      FIRST_ROWS(1000)
      OUTLINE_LEAF(@"SEL$1")
      FULL(@"SEL$1" "BIG_TABLE"@"SEL$1")
      END_OUTLINE_DATA
  */

Predicate Information (identified by operation id):
---------------------------------------------------

   2 - filter("P_ID"=:SYS_B_0)

Note
-----
   - outline "FULL_TABLE" used for this statement
   - Warning: basic plan statistics not available. These are only collected when:
       * hint 'gather_plan_statistics' is used for the statement or
       * parameter 'statistics_level' is set to 'ALL', at session or system level

Related Post
Changing Execution Plan Using Stored Outline

Useful metalink notes
Stored Outline Quick Reference [ID 67536.1]
How to Transfer Stored Outlines from One Database to Another (9i and above) [ID 728647.1]

Wednesday, January 2, 2013

enq: US - contention and row cache lock waits

High waits on enq: US - contention and row cache lock was seen during a load test on a two node cluster. On the statspack reports these two wait events were among the top 5 wait evetns
Top 5 Timed Events                                                    Avg %Total
~~~~~~~~~~~~~~~~~~                                                   wait   Call
Event                                            Waits    Time (s)   (ms)   Time
----------------------------------------- ------------ ----------- ------ ------
enq: US - contention                             7,498       4,035    538   21.9
row cache lock                                   8,486       1,240    146    6.7
During normal operation there was no waits on enq: US - contention and row cache lock waits were between 0 - 4. High wait events only appear during the load test when the system is stressed.
The first peaks on the following graphs corresponds to high waits on above events observed during the initial load test.
enq: US - contention

row cache lock waits

Although 1332738.1 suggested this is related to undo segments and could be seen dc_rollback_segments. But there was not much difference between this metric during problem period and a good period. Below is the problem period
Cache                         Requests   Miss    Reqs  Miss     Reqs      Usage
------------------------- ------------ ------ ------- ----- -------- ----------
dc_objects                     105,703    0.1       0              0      5,389
dc_rollback_segments            38,780    0.3       0            250        514
dc_segments                      4,234    5.0       0             12      2,719
dc_tablespaces                 165,248    0.0       0              0         21
dc_users                       178,080    0.0       0              0        222
The good period
Cache                         Requests   Miss    Reqs  Miss     Reqs      Usage
------------------------- ------------ ------ ------- ----- -------- ----------
dc_objects                     284,414    0.5       0              8      2,753
dc_rollback_segments            22,307    0.0       0              0        515
dc_segments                     17,724    7.9       0             10      1,790
dc_tablespaces                 142,346    0.0       0              0         21
dc_users                       158,440    0.0       0              0        116
Comparing the above two there's only a slight difference but comparing GES stats shows following for problem period
Cache                         Requests    Conflicts     Releases
------------------------- ------------ ------------ ------------
dc_objects                          84            2            0
dc_rollback_segments               511          133            0
dc_segments                        352            6            0
and no requests or conflicts for dc_rollback_segments during good period.
Datafile assigned to undo tablespaces has auto extensible on and has enough free space on the disk to extend the datafile. Therefore 420525.1 and 413732.1 wasn't much of a help.
742035.1 and 7291739.8 mentions bug 7291739 which materializes in high contention on above two wait events when autotuned undo retention is in use. Therefore applied the patch for bug 7291739 and set the parameter _first_spare_parameter value to the run length of the longest running query found on v$undostat(as this is 11.1, other version may require HIGHTHRESHOLD_UNDORETENTION refer above mention notes). Running the load test again didn't show any improvement and high waits could still be seen (second peak on the above graphs).


Raised a SR. Oracle couldn't determine why the patch is not effective in reducing the high wait events and suggested another hidden parameter rollback_segment_count(also mentioned as a work around on 1332738.1) It was recommended to set a value of 1.5 times the online undo segments for this parameter.
SQL> select TABLESPACE_NAME,count(*) from DBA_ROLLBACK_SEGS where status='ONLINE' group by tablespace_name;

TABLESPACE_NAME   COUNT(*)
--------------- ----------
UNDOTBS1               323
SYSTEM                   1
UNDOTBS2               300
According to Oracle the value set is for "entire instance not for undo tablespace" which I would imagine means per database and not per instance. This value act as the "lower limit for the number of undo segments online at a given time". Setting this value doesn't result in database proactively online number of undo segments as specified. It is the minimum number of undo segments to kept online and only comes into play if the number of undo segments goes beyond the value specified. So going by the above statistics the value to set would be (323 + 300) x 1.5 = 935. One more thing is that this value is not dynamic and requires a restart (Not an ideal workaround for a busy production system).
After above value is set running the load test did not result in any enq: US - contention waits. It should be noted that patch was still in place even with this parameter set, but highly unlikely that it had contributed to resolve the high waits. It is possible that rollback_segment_count alone is responsible for reducing the high waits. This would be verified once the patch is roll backed later on.

Useful metalink notes
Full UNDO Tablespace In 10gR2 [ID 413732.1]
Contention Under Auto-Tuned Undo Retention [ID 742035.1]
Automatic Tuning of Undo_retention Causes Space Problems [ID 420525.1]
How to correct performance issues with enq: US - contention related to undo segments [ID 1332738.1]
Bug 7291739 - Contention with auto-tuned undo retention or high TUNED_UNDORETENTION [ID 7291739.8]

Tuesday, January 1, 2013

Changing Execution Plan Using Stored Outline

Stored outline is still the only option available on standard edition databases for achieving plan stability. On 11gR2 there's dbms_spm.MIGRATE_STORED_OUTLINE to migrate stored outlines to plan baselines but that doesn't work on standard edition.
This post list steps to change the execution plan of a SQL query using stored outlines. The environment is Standard Edition 11gR1 (11.1.0.7.13) running on RHEL 5 (64bit). The cursor_sharing is set to similar. How cursor_sharing affect stored outline is available on 132547.1
1. Grant the user creating stored outlines following privileges
grant create any outline to asanga;
grant alter any outline to asanga;
2. Following SQL is considered the original SQL of which execution plan will be changed
SQL> select count(*) from big_table where p_id=15151;
Currently the above SQL's plan uses an index and this will be changed to use a full table scan (no consideration is given to the suitability of this change, it's merely used to illustrate how to change the execution plan using stored outlines). Generate the desired execution plan, in this case this is done using hints
SQL> select /*+ full(big_table) */ count(*) from big_table where p_id=151;
This generates two sql id as the sql text is different
SQL> select sql_id,hash_value,child_number,sql_text from v$sql where sql_text like '%big_table%';

SQL_ID        HASH_VALUE CHILD_NUMBER SQL_TEXT
------------- ---------- ------------ ---------------------------------------------------------------------------
80151fvm1d9af 3860243790            0 select count(*) from big_table where p_id=:"SYS_B_0"
81920u5c0ufyb 1477262283            0 select /*+ full(big_table) */ count(*) from big_table where p_id=:"SYS_B_0"
4. Stored outlines will be created using these two plans. DBMS_OUTLN.CREATE_OUTLINE will be used as it allows to create stored outlines from existing cursors (445126.1)
SQL> alter session set create_stored_outlines = TRUE;

SQL> exec dbms_outln.CREATE_OUTLINE(3860243790,0);
PL/SQL procedure successfully completed.

SQL> exec dbms_outln.CREATE_OUTLINE(1477262283,0);
PL/SQL procedure successfully completed.

SQL> alter session set create_stored_outlines = false;
6. This would have generated two stored outlines. Which could be viewed using user_otulines view
SQL> select name,sql_text from user_outlines;

NAME                           SQL_TEXT
------------------------------ ---------------------------------------------------------------------------
SYS_OUTLINE_12121716093232802  select count(*) from big_table where p_id=:"SYS_B_0"
SYS_OUTLINE_12121716094181604  select /*+ full(big_table) */ count(*) from big_table where p_id=:"SYS_B_0"
5. Give easily identifiable names to stored outline so it is easier to identify which outline is associated with which plan. In this case SYS_OUTLINE_12121716093232802 is associated with plan using the index and SYS_OUTLINE_12121716094181604 is associated with plan using full table scan.
SQL> alter outline SYS_OUTLINE_12121716093232802 rename to with_index;
Outline altered.

SQL> alter outline SYS_OUTLINE_12121716094181604 rename to full_table;
Outline altered.
          
SQL> select name,sql_text from user_outlines;

NAME                           SQL_TEXT
------------------------------ ---------------------------------------------------------------------------
WITH_INDEX                     select count(*) from big_table where p_id=:"SYS_B_0"
FULL_TABLE                     select /*+ full(big_table) */ count(*) from big_table where p_id=:"SYS_B_0"
7. Enable use of stored outlines on the system.
SQL> alter system set use_stored_outlines=true
This could be done for session as well. Stored outlines are not enable by default. To enable stored outlines during system start up add a on database trigger and include the statement above inside the trigger.
create or replace trigger enable_outlines_trig
after startup on database
begin
sys.dbms_system.ksdwrt(2, 'AP-ORA-01 going to enable outline');
execute immediate('alter system set use_stored_outlines=true');
sys.dbms_system.ksdwrt(2, 'AP-ORA-01 outline enabled');
end;
/
Above trigger will add entries to alert.log. Refer 560331.1 for more information.
8. Once the use of stored outline is enable it's time to check if they get used when SQL get executed. user_outlines has a column called used which will say used or noused but in this case display_cursor will be used to see if an outline is used with the SQL.
SQL>  select count(*) from big_table where p_id=1;

SQL> select * from table(dbms_xplan.display_cursor(null,null,'ALLSTATS OUTLINE'));
SQL_ID  80151fvm1d9af, child number 0
-------------------------------------
select count(*) from big_table where p_id=:"SYS_B_0"

Plan hash value: 1795900200

-----------------------------------------------
| Id  | Operation         | Name     | E-Rows |
-----------------------------------------------
|   0 | SELECT STATEMENT  |          |        |
|   1 |  SORT AGGREGATE   |          |      1 |
|*  2 |   INDEX RANGE SCAN| P_ID_IDX |      2 |
-----------------------------------------------

Outline Data
-------------

  /*+
      BEGIN_OUTLINE_DATA
      IGNORE_OPTIM_EMBEDDED_HINTS
      OPTIMIZER_FEATURES_ENABLE('11.1.0.7')
      DB_VERSION('11.1.0.7')
      OPT_PARAM('_optimizer_extended_cursor_sharing' 'none')
      OPT_PARAM('_optimizer_extended_cursor_sharing_rel' 'none')
      OPT_PARAM('optimizer_index_cost_adj' 25)
      OPT_PARAM('optimizer_index_caching' 90)
      FIRST_ROWS(1000)
      OUTLINE_LEAF(@"SEL$1")
      INDEX(@"SEL$1" "BIG_TABLE"@"SEL$1" ("BIG_TABLE"."P_ID"))
      END_OUTLINE_DATA
  */

Predicate Information (identified by operation id):
---------------------------------------------------

   2 - access("P_ID"=:SYS_B_0)

Note
-----
   - outline "WITH_INDEX" used for this statement
   - Warning: basic plan statistics not available. These are only collected when:
       * hint 'gather_plan_statistics' is used for the statement or
       * parameter 'statistics_level' is set to 'ALL', at session or system level
This shows that outline associated with index plan is being used when the original sql is run.
SQL> select /*+ full(big_table) */ count(*) from big_table where p_id=2;

SQL> select * from table(dbms_xplan.display_cursor(null,null,'ALLSTATS OUTLINE'));
SQL_ID  81920u5c0ufyb, child number 0
-------------------------------------
select /*+ full(big_table) */ count(*) from big_table where
p_id=:"SYS_B_0"

Plan hash value: 599409829

-------------------------------------------------
| Id  | Operation          | Name      | E-Rows |
-------------------------------------------------
|   0 | SELECT STATEMENT   |           |        |
|   1 |  SORT AGGREGATE    |           |      1 |
|*  2 |   TABLE ACCESS FULL| BIG_TABLE |      2 |
-------------------------------------------------

Outline Data
-------------

  /*+
      BEGIN_OUTLINE_DATA
      IGNORE_OPTIM_EMBEDDED_HINTS
      OPTIMIZER_FEATURES_ENABLE('11.1.0.7')
      DB_VERSION('11.1.0.7')
      OPT_PARAM('_optimizer_extended_cursor_sharing' 'none')
      OPT_PARAM('_optimizer_extended_cursor_sharing_rel' 'none')
      OPT_PARAM('optimizer_index_cost_adj' 25)
      OPT_PARAM('optimizer_index_caching' 90)
      FIRST_ROWS(1000)
      OUTLINE_LEAF(@"SEL$1")
      FULL(@"SEL$1" "BIG_TABLE"@"SEL$1")
      END_OUTLINE_DATA
  */

Predicate Information (identified by operation id):
---------------------------------------------------

   2 - filter("P_ID"=:SYS_B_0)

Note
-----
   - outline "FULL_TABLE" used for this statement
   - Warning: basic plan statistics not available. These are only collected when:
       * hint 'gather_plan_statistics' is used for the statement or
       * parameter 'statistics_level' is set to 'ALL', at session or system level
This shows that when the SQL run with full table hint the full_table outline get used. Next step is to make the original SQL execute with plan generated for SQL with the hint.
9. Create two private outlines from the two outlines created above
SQL> create private outline myindex from with_index;
Outline created.

SQL> create private outline myfulltable from full_table;
Outline created.

SQL> select ol_name from ol$;
MYINDEX
MYFULLTABLE
These private outlines will be modified such that MYFULLTABLE outline will be associated with the MYINDEX outline's hints. Set the hint count of MYINDEX to match the hint count of MYFULLTABLE
SQL> update ol$ set hintcount=(select hintcount from ol$ where ol_name='MYFULLTABLE') where ol_name='MYINDEX';

1 row updated.
Delete the MYFULLTABLE private outline record
SQL> delete from ol$ where ol_name='MYFULLTABLE';

1 row deleted.
Rename the MYINDEX outline as MYFULLTABLE
SQL> update ol$ set ol_name='MYFULLTABLE' where ol_name='MYINDEX';

1 row updated.
At the end of this there will be only one private outline and it will be associated with the original SQL text
SQL> select ol_name,sql_text from ol$;
MYFULLTABLE                    select count(*) from big_table where p_id=:"SYS_B_0"
Execute a commit as ol$* tables are temporary tables and refresh the private outline.
SQL> commit;

Commit complete.

SQL> execute dbms_outln_edit.refresh_private_outline('MYFULLTABLE');
PL/SQL procedure successfully completed.
10. Before the private outline is made permanent it would be tested by making session to use private outlines instead of public outlines.
SQL> alter session set use_private_outlines=true;
Session altered.

SQL>  select count(*) from big_table where p_id=1;

SQL> select * from table(dbms_xplan.display_cursor(null,null,'ALLSTATS OUTLINE'));
SQL_ID  02971r98szzu3, child number 0
-------------------------------------
 select count(*) from big_table where p_id=:"SYS_B_0"

Plan hash value: 599409829

-------------------------------------------------
| Id  | Operation          | Name      | E-Rows |
-------------------------------------------------
|   0 | SELECT STATEMENT   |           |        |
|   1 |  SORT AGGREGATE    |           |      1 |
|*  2 |   TABLE ACCESS FULL| BIG_TABLE |      2 |
-------------------------------------------------

Outline Data
-------------

  /*+
      BEGIN_OUTLINE_DATA
      IGNORE_OPTIM_EMBEDDED_HINTS
      OPTIMIZER_FEATURES_ENABLE('11.1.0.7')
      DB_VERSION('11.1.0.7')
      OPT_PARAM('_optimizer_extended_cursor_sharing' 'none')
      OPT_PARAM('_optimizer_extended_cursor_sharing_rel' 'none')
      OPT_PARAM('optimizer_index_cost_adj' 25)
      OPT_PARAM('optimizer_index_caching' 90)
      FIRST_ROWS(1000)
      OUTLINE_LEAF(@"SEL$1")
      FULL(@"SEL$1" "BIG_TABLE"@"SEL$1")
      END_OUTLINE_DATA
  */

Predicate Information (identified by operation id):
---------------------------------------------------

   2 - filter("P_ID"=:SYS_B_0)

Note
-----
   - outline "MYFULLTABLE" used for this statement
   - Warning: basic plan statistics not available. These are only collected when:
       * hint 'gather_plan_statistics' is used for the statement or
       * parameter 'statistics_level' is set to 'ALL', at session or system level
From the output it could be seen that private outline is being used and execution plan has changed to full table scan and the SQL text is the original SQL text.
11. Update public outline with the private outline and turn-off the use of private outlines
SQL> create or replace outline full_table from private MYFULLTABLE;
Outline created.

SQL> alter session set use_private_outlines=false;
12. At this stage there's only one public outline available (instead of two started with) and that will be associated with the full table scan plan.
SQL> select name,sql_text from user_outlines;

NAME         SQL_TEXT
------------ ----------------------------------------------------
FULL_TABLE   select count(*) from big_table where p_id=:"SYS_B_0"

SQL> SELECT node, stage, join_pos, hint  FROM user_outline_hints WHERE name ='FULL_TABLE';
         1          1          0 OUTLINE_LEAF(@"SEL$1")
         1          1          0 FIRST_ROWS(1000)
         1          1          0 OPT_PARAM('optimizer_index_caching' 90)
         1          1          0 OPT_PARAM('_optimizer_extended_cursor_sharing_rel' 'none')
         1          1          0 DB_VERSION('11.1.0.7')
         1          1          0 IGNORE_OPTIM_EMBEDDED_HINTS
         1          1          0 OPTIMIZER_FEATURES_ENABLE('11.1.0.7')
         1          1          0 OPT_PARAM('_optimizer_extended_cursor_sharing' 'none')
         1          1          0 OPT_PARAM('optimizer_index_cost_adj' 25)
         1          1          1 FULL(@"SEL$1" "BIG_TABLE"@"SEL$1")
13. Execute the original SQL text and confirm the modified outline is used
SQL>  select count(*) from big_table where p_id=151;

SQL> select * from table(dbms_xplan.display_cursor(null,null,'ALLSTATS OUTLINE'));
SQL_ID  80151fvm1d9af, child number 0
-------------------------------------
select count(*) from big_table where p_id=:"SYS_B_0"

Plan hash value: 599409829

-------------------------------------------------
| Id  | Operation          | Name      | E-Rows |
-------------------------------------------------
|   0 | SELECT STATEMENT   |           |        |
|   1 |  SORT AGGREGATE    |           |      1 |
|*  2 |   TABLE ACCESS FULL| BIG_TABLE |      2 |
-------------------------------------------------

Outline Data
-------------

  /*+
      BEGIN_OUTLINE_DATA
      IGNORE_OPTIM_EMBEDDED_HINTS
      OPTIMIZER_FEATURES_ENABLE('11.1.0.7')
      DB_VERSION('11.1.0.7')
      OPT_PARAM('_optimizer_extended_cursor_sharing' 'none')
      OPT_PARAM('_optimizer_extended_cursor_sharing_rel' 'none')
      OPT_PARAM('optimizer_index_cost_adj' 25)
      OPT_PARAM('optimizer_index_caching' 90)
      FIRST_ROWS(1000)
      OUTLINE_LEAF(@"SEL$1")
      FULL(@"SEL$1" "BIG_TABLE"@"SEL$1")
      END_OUTLINE_DATA
  */

Predicate Information (identified by operation id):
---------------------------------------------------

   2 - filter("P_ID"=:SYS_B_0)

Note
-----
   - outline "FULL_TABLE" used for this statement
   - Warning: basic plan statistics not available. These are only collected when:
       * hint 'gather_plan_statistics' is used for the statement or
       * parameter 'statistics_level' is set to 'ALL', at session or system level
This concludes how to change the execution plan using stored outlines.


However using stored outlines on JDBC application has an additional challenge. This has to do with how literals are replaced with bind variables when using SQL*plus and JDBC. Running the original SQL text through JDBC application doesn't result in the stored outline being used.
SQL> select sql_id from v$sql where sql_text like '%big_table%';

4378mr12fsdrp

SQL> select * from table(dbms_xplan.display_cursor('4378mr12fsdrp',0,'ALLSTATS OUTLINE'));
SQL_ID  4378mr12fsdrp, child number 0
-------------------------------------
select count(*) from big_table where p_id=:1

Plan hash value: 1795900200

-----------------------------------------------
| Id  | Operation         | Name     | E-Rows |
-----------------------------------------------
|   0 | SELECT STATEMENT  |          |        |
|   1 |  SORT AGGREGATE   |          |      1 |
|*  2 |   INDEX RANGE SCAN| P_ID_IDX |      2 |
-----------------------------------------------

Outline Data
-------------

  /*+
      BEGIN_OUTLINE_DATA
      IGNORE_OPTIM_EMBEDDED_HINTS
      OPTIMIZER_FEATURES_ENABLE('11.1.0.7')
      DB_VERSION('11.1.0.7')
      OPT_PARAM('_optimizer_extended_cursor_sharing' 'none')
      OPT_PARAM('_optimizer_extended_cursor_sharing_rel' 'none')
      OPT_PARAM('optimizer_index_cost_adj' 25)
      OPT_PARAM('optimizer_index_caching' 90)
      FIRST_ROWS(1000)
      OUTLINE_LEAF(@"SEL$1")
      INDEX(@"SEL$1" "BIG_TABLE"@"SEL$1" ("BIG_TABLE"."P_ID"))
      END_OUTLINE_DATA
  */

Predicate Information (identified by operation id):
---------------------------------------------------

   2 - access("P_ID"=:1)

Note
-----
   - Warning: basic plan statistics not available. These are only collected when:
       * hint 'gather_plan_statistics' is used for the statement or
       * parameter 'statistics_level' is set to 'ALL', at session or system level
There's no mention of stored outline being used in the note section and plan is using a index range scan instead of full table scan. More over a new sql id is also generated.
SQL> select sql_id,sql_text from v$sql where sql_text like '%big_table%';

SQL_ID        SQL_TEXT
------------- ----------------------------------------------------
4378mr12fsdrp select count(*) from big_table where p_id=:1
80151fvm1d9af select count(*) from big_table where p_id=:"SYS_B_0"
Comparing the two sql text is could be seen that only difference is the text used for bind variables. In JDBC :1,:2,:3 and etc is used for bind variables while on SQL plus with cursor_sharing set to similar or force a text is used SYS_B_0,SYS_B_1 and etc. This makes the two SQL non-identical thus resulting in a new SQL id and outline not being used.
In order to outline to be used create a new outline for JDBC SQL text and associate all hints in the existing outline with it.
SQL> alter session set create_stored_outlines = TRUE;
Session altered.

SQL> exec dbms_outln.CREATE_OUTLINE(1156331253,0);
PL/SQL procedure successfully completed.

SQL> alter session set create_stored_outlines = false;
Session altered.

SQL> select name,sql_text from user_outlines;

NAME                           SQL_TEXT
------------------------------ ------------------------------------------------------
SYS_OUTLINE_12121716491461306  select count(*) from big_table where p_id=:1
FULL_TABLE                     select count(*) from big_table where p_id=:"SYS_B_0"

SQL> alter outline SYS_OUTLINE_12121716491461306 rename to jdbc_outline;
Outline altered.

SQL> create or replace private outline myfulltable from full_table;
Outline created.

SQL>  create or replace private outline myjdbc from jdbc_outline;
Outline created.

SQL> select ol_name from ol$;

OL_NAME
------------------------------
MYFULLTABLE
MYJDBC

SQL> SELECT ol_name,sql_text from ol$;

OL_NAME                        SQL_TEXT
------------------------------ ------------------------------------------------------
MYFULLTABLE                    select count(*) from big_table where p_id=:"SYS_B_0"
MYJDBC                         select count(*) from big_table where p_id=:1


SQL> update ol$ set hintcount=(select hintcount from ol$ where ol_name='MYFULLTABLE') where ol_name='MYJDBC';
1 row updated.

SQL> delete from ol$ where ol_name='MYFULLTABLE';
1 row deleted.

SQL> update ol$ set ol_name='MYFULLTABLE' where ol_name='MYJDBC';
1 row updated.

SQL> commit;

SQL> SELECT ol_name,sql_text from ol$;

OL_NAME                        SQL_TEXT
------------------------------ ----------------------------------------------
MYFULLTABLE                    select count(*) from big_table where p_id=:1


SQL>  execute dbms_outln_edit.refresh_private_outline('MYFULLTABLE');
PL/SQL procedure successfully completed.

SQL> create or replace outline jdbc_outline from private MYFULLTABLE;
Outline created.

SQL> alter session set use_private_outlines=false;
Session altered.

SQL> select name,sql_text from user_outlines;

NAME                           SQL_TEXT
------------------------------ -----------------------------------------------------
JDBC_OUTLINE                   select count(*) from big_table where p_id=:1
FULL_TABLE                     select count(*) from big_table where p_id=:"SYS_B_0"
After the stored outline change executing the original SQL text through JDBC shows the newly created outline being used and execution plan using full table scan.
SQL> select * from table(dbms_xplan.display_cursor('4378mr12fsdrp',0,'ALLSTATS OUTLINE'));
SQL_ID  4378mr12fsdrp, child number 0
-------------------------------------
select count(*) from big_table where p_id=:1

Plan hash value: 599409829

-------------------------------------------------
| Id  | Operation          | Name      | E-Rows |
-------------------------------------------------
|   0 | SELECT STATEMENT   |           |        |
|   1 |  SORT AGGREGATE    |           |      1 |
|*  2 |   TABLE ACCESS FULL| BIG_TABLE |      2 |
-------------------------------------------------

Outline Data
-------------

  /*+
      BEGIN_OUTLINE_DATA
      IGNORE_OPTIM_EMBEDDED_HINTS
      OPTIMIZER_FEATURES_ENABLE('11.1.0.7')
      DB_VERSION('11.1.0.7')
      OPT_PARAM('_optimizer_extended_cursor_sharing' 'none')
      OPT_PARAM('_optimizer_extended_cursor_sharing_rel' 'none')
      OPT_PARAM('optimizer_index_cost_adj' 25)
      OPT_PARAM('optimizer_index_caching' 90)
      FIRST_ROWS(1000)
      OUTLINE_LEAF(@"SEL$1")
      FULL(@"SEL$1" "BIG_TABLE"@"SEL$1")
      END_OUTLINE_DATA
  */

Predicate Information (identified by operation id):
---------------------------------------------------

   2 - filter("P_ID"=:1)

Note
-----
   - outline "JDBC_OUTLINE" used for this statement
   - Warning: basic plan statistics not available. These are only collected when:
       * hint 'gather_plan_statistics' is used for the statement or
       * parameter 'statistics_level' is set to 'ALL', at session or system level

Useful metalink notes
Using Stored Outlines [ID 132547.1]
Stored Outline Not Working [ID 802044.1]
Stored Outline Quick Reference [ID 67536.1]
Session Parameter: USE_STORED_OUTLINES [ID 68642.1]
How To Match a SQL Statement to a Stored Outline [ID 743312.1]
Editing Stored Outlines in Oracle10g and Oracle11g [ID 726802.1]
How to Enable USE_STORED_OUTLINES Permanently [ID 560331.1]
How To retreive the Outline Data from a stored execution plan [ID 736529.1]
HOW TO: Create a Stored Outline Based Upon an Existing Cursor [ID 445126.1]
How to generate an outline with a good plan loaded into shared_pool [ID 463288.1]
How to Edit a Stored Outline to Use the Plan from Another Stored Outline [ID 730062.1]
How to Transfer Stored Outlines from One Database to Another (9i and above) [ID 728647.1]

Monday, October 8, 2012

Guarantee Restore Point Leads to High DB File Sequential Read Waits on Undo Tablespace in 11gR2

Guarantee restore points are useful to have in test environments which allows easy rollback of the database so test could be run again without having to have a new data sets for inserts that can cause primary key violation.
However it seems having a guarantee restore point can cause excessive db file sequential read waits on the undo tablespace for insert statements. This could alter the performance characteristics of test.
Following test case could be used to recreate this behavior. The test environment used here is 11gR2 (11.2.0.3.3).
Create the table for the test case
create table ses_lock (sid varchar2(100) primary key);
Open 3 sql plus session (called 1,2 and 3 from now on) and run the following pl/sql blocks on each one.
On session 1 create and hold a lock to start the concurrent insert process
declare
    i pls_integer;
begin
    i := dbms_lock.request(10);
end;
/
On session 2 run the PL/SQL for the insert statment
declare
    i pls_integer;
begin
    i := dbms_lock.request(10,DBMS_LOCK.S_MODE);

    for i in 1 .. 100000
    loop
     insert into ses_lock values (dbms_random.string('x',36));
     commit;
    end loop;
     i := dbms_lock.release(10);
end;
/
Run the same on sesison 3
declare
    i pls_integer;
begin
    i := dbms_lock.request(10,DBMS_LOCK.S_MODE);

    for i in 1 .. 100000
    loop
     insert into ses_lock values (dbms_random.string('x',36));
     commit;
    end loop;
     i := dbms_lock.release(10);
end;
/
and finaly on session 1 release the lock
declare
    j pls_integer;
begin
    j := dbms_lock.release(10);
end;
/
This will start concurrent insert into the table.
Investigating the active session history during this period for the insert sql shows that db file sequential reads are on datafile 14 which is the datafile where the table resides.
select inst_id,p1,p1text,sql_id,count(*)
from gv$active_session_history
where sample_time >  to_date('2012-09-17 11:37','YYYY-MM-DD HH24:MI')
and event ='db file sequential read'
group by inst_id, p1, p1text, sql_id
order by 5 desc,1 ,2;

INST_ID  P1  P1TEXT SQL_ID        COUNT(*)         
-------- --- ------ ------------- ---------
1        14  file#  7pj2bbx25m1rf 30                     

SQL> select sql_id,sql_text from v$sql where sql_id='7pj2bbx25m1rf';

SQL_ID        SQL_TEXT
------------- ------------------------------------------------------------
7pj2bbx25m1rf INSERT INTO SES_LOCK VALUES (DBMS_RANDOM.STRING('x',36))

SQL> select file_id,tablespace_name from dba_data_files where file_id=14;

FILE_ID TABLESPACE_NAME
------- -----------------
14      BX2KTBS
Delete the rows in the table and create a guarantee restore point
SQL> delete from ses_lock;
200000 rows deleted.

SQL> commit;
It is possible to create a guarantee restore point in 11gR2 without having flashback on. Before guarantee restore point is created
SQL> select flashback_on from v$database;

FLASHBACK_ON
-------------
NO
After guarantee restore point
SQL> create restore point first_restore guarantee flashback database;

SQL> select flashback_on from v$database;

FLASHBACK_ON
------------------
RESTORE POINT ONLY
Create 3 sql*plus sessions mentioned above and run the insert again.
Querying the active session history afterwards shows that during this test the db file sequential read waits were on the data file used for the undo tablespace and much higher number of waits compared to test without the guarantee restore point.
select inst_id,p1,p1text,sql_id,count(*)
from gv$active_session_history
where sample_time >  to_date('2012-09-17 12:02','YYYY-MM-DD HH24:MI')
and event ='db file sequential read'
group by inst_id, p1, p1text, sql_id
order by 5 desc,1 ,2;

INST_ID  P1  P1TEXT SQL_ID        COUNT(*)         
-------- --- ------ ------------- ---------
1        3   file#  7pj2bbx25m1rf 266    

SQL> select file_id,tablespace_name from dba_data_files where file_id in (3,14);

FILE_ID  TABLESPACE_NAME
-------- ---------------
3        UNDOTBS1
14       BX2KTBS
Dropped the restore point and ran the test again and this time there was no db file sequential waits and as soon as the restore point is created and test carried out see lots of db file sequential read waits on undo tablespace data file. Below is the output of querying active session history for the second test with restore point thus confirming that observed behavior is repeatable with the test case
select inst_id,p1,p1text,sql_id,count(*)
from gv$active_session_history
where sample_time >  to_date('2012-09-17 12:20','YYYY-MM-DD HH24:MI')
and event ='db file sequential read'
group by inst_id, p1, p1text, sql_id
order by 5 desc,1 ,2;

INST_ID  P1  P1TEXT SQL_ID        COUNT(*)         
-------- --- ------ ------------- ---------
1        3   file#  7pj2bbx25m1rf 193    
-->


SQL tracing could also be used to demonstrate this problem. This is useful if the database is standard edition where use of active session history view is not an option because of license restrictions.
Enable sql tracing for the session
alter session set max_dump_file_size=UNLIMITED;
alter session set  tracefile_identifier='before_grp';
alter session set events '10046 trace name context forever, level 12';
Run the insert statement, this time only using on session
declare
    i pls_integer;
begin
    i := dbms_lock.request(10,DBMS_LOCK.S_MODE);

    for i in 1 .. 100000
    loop
     insert into ses_lock values (dbms_random.string('x',36));
     commit;
    end loop;
     i := dbms_lock.release(10);
end;
/
Formatted trace file output shows no waits for db file sequential read wait event
SQL ID: dqhz25akp92bp Plan Hash: 0

INSERT INTO SES_LOCK VALUES (DBMS_RANDOM.STRING('x',36))

call     count       cpu    elapsed       disk      query    current        rows
------- ------  -------- ---------- ---------- ---------- ----------  ----------
Parse        1      0.00       0.00          0          0          0           0
Execute 100000     14.95      14.77          0       2746     517465      100000
Fetch        0      0.00       0.00          0          0          0           0
------- ------  -------- ---------- ---------- ---------- ----------  ----------
total   100001     14.95      14.77          0       2746     517465      100000

Misses in library cache during parse: 1
Optimizer mode: FIRST_ROWS
Parsing user id: 84     (recursive depth: 1)
Number of plan statistics captured: 1

Rows (1st) Rows (avg) Rows (max)  Row Source Operation
---------- ---------- ----------  ---------------------------------------------------
         0          0          0  LOAD TABLE CONVENTIONAL  (cr=155 pr=5 pw=0 time=35733 us)

Elapsed times include waiting on following events:
  Event waited on                             Times   Max. Wait  Total Waited
  ----------------------------------------   Waited  ----------  ------------
  Disk file operations I/O                        2        0.00          0.00
  latch: In memory undo latch                     1        0.00          0.00
  log file switch completion                      2        0.00          0.01
  latch free                                      1        0.00          0.00
********************************************************************************
Delete all rows from the table and create restore point
SQL> delete from ses_lock;
100000 rows deleted.

SQL>commit;
Commit complete.

SQL> create restore point first_restore guarantee flashback database;
Run the test again
alter session set max_dump_file_size=UNLIMITED;
alter session set  tracefile_identifier='after_grp';
alter session set events '10046 trace name context forever, level 12';

declare
    i pls_integer;
begin
    i := dbms_lock.request(10,DBMS_LOCK.S_MODE);

    for i in 1 .. 100000
    loop
     insert into ses_lock values (dbms_random.string('x',36));
     commit;
    end loop;
     i := dbms_lock.release(10);
end;
/
and formatted output of trace file shows high number of db file sequential read waits compared to previous test
SQL ID: dqhz25akp92bp Plan Hash: 0

INSERT INTO SES_LOCK VALUES (DBMS_RANDOM.STRING('x',36))

call     count       cpu    elapsed       disk      query    current        rows
------- ------  -------- ---------- ---------- ---------- ----------  ----------
Parse        1      0.00       0.00          0          0          0           0
Execute 100000     20.71      22.50       3507        107     513257      100000
Fetch        0      0.00       0.00          0          0          0           0
------- ------  -------- ---------- ---------- ---------- ----------  ----------
total   100001     20.71      22.50       3507        107     513257      100000

Misses in library cache during parse: 1
Optimizer mode: FIRST_ROWS
Parsing user id: 84     (recursive depth: 1)
Number of plan statistics captured: 1

Rows (1st) Rows (avg) Rows (max)  Row Source Operation
---------- ---------- ----------  ---------------------------------------------------
         0          0          0  LOAD TABLE CONVENTIONAL  (cr=1 pr=0 pw=0 time=1844 us)

Elapsed times include waiting on following events:
  Event waited on                             Times   Max. Wait  Total Waited
  ----------------------------------------   Waited  ----------  ------------
  Disk file operations I/O                        2        0.00          0.00
  db file sequential read                      3507        0.11          3.78
  log file switch (checkpoint incomplete)         3        0.00          0.00
  latch: redo allocation                          1        0.00          0.00
  log file switch completion                      1        0.06          0.06
********************************************************************************
Inspecting trace file itself could see details of the wait event and wait is on file#=3
WAIT #46953194410944: nam='db file sequential read' ela= 277 file#=3 block#=16505 blocks=1 obj#=0 tim=1349341486136362
WAIT #46953194410944: nam='db file sequential read' ela= 263 file#=3 block#=17317 blocks=1 obj#=0 tim=1349341486138981
WAIT #46953194410944: nam='db file sequential read' ela= 330 file#=3 block#=16955 blocks=1 obj#=0 tim=1349341486149736
WAIT #46953194410944: nam='db file sequential read' ela= 387 file#=3 block#=17076 blocks=1 obj#=0 tim=1349341486152818
WAIT #46953194410944: nam='db file sequential read' ela= 15 file#=3 block#=16839 blocks=1 obj#=0 tim=1349341486161143
File#=3 is the datafile used with the undo tablespace.
Drop the restore point and the db file sequential read event disappear, output below after restore point is dropped
SQL ID: dqhz25akp92bp Plan Hash: 0

INSERT INTO SES_LOCK VALUES (DBMS_RANDOM.STRING('x',36))

call     count       cpu    elapsed       disk      query    current        rows
------- ------  -------- ---------- ---------- ---------- ----------  ----------
Parse        1      0.00       0.00          0          0          0           0
Execute 100000     15.44      14.60          0         67     593197      100000
Fetch        0      0.00       0.00          0          0          0           0
------- ------  -------- ---------- ---------- ---------- ----------  ----------
total   100001     15.44      14.60          0         67     593197      100000

Misses in library cache during parse: 0
Optimizer mode: FIRST_ROWS
Parsing user id: 84     (recursive depth: 1)
Number of plan statistics captured: 1

Rows (1st) Rows (avg) Rows (max)  Row Source Operation
---------- ---------- ----------  ---------------------------------------------------
         0          0          0  LOAD TABLE CONVENTIONAL  (cr=1 pr=0 pw=0 time=1613 us)

Elapsed times include waiting on following events:
  Event waited on                             Times   Max. Wait  Total Waited
  ----------------------------------------   Waited  ----------  ------------
  log file switch (checkpoint incomplete)         4        0.00          0.01
  latch: cache buffers chains                     1        0.00          0.00
  Disk file operations I/O                        1        0.00          0.00
********************************************************************************
SR was raised with Oracle and response was that "this is similar to Bug 12921374 : GURANTEED RESTORE POINT CAUSES MANY PHYSICAL READS." However there has not been any movement on this bug since Feb 2012 and there's no solution or workaround. As a result of this SR a new bug report has been created which is available under "Bug 14671654 : GUARANTEE RESTORE POINT PROVOKES HIGH"
The same test was carried out on 11.1.0.7 (11.1.0.7.12) and it didn't have the same behavior as 11gR2. So the issue is localized to 11gR2.(Update 2014/11/21-11.1 also exhibit the same behavior. Depending on when the table is created and when the restore point is created the location of the wait event on the trace file differ. Looking only at the insert statement may result in missing the high waits shown under the commit. Either way total number of waits for the test case on 11.1 is not different to that of 11.2)

Update 15 July 2013
The issue is also there on 12c (12.1.0.1). Below is the tkprof output after the same test done on a 12c.Before restore point creation
SQL ID: dqhz25akp92bp Plan Hash: 0

INSERT INTO SES_LOCK
VALUES
 (DBMS_RANDOM.STRING('x',36))


call     count       cpu    elapsed       disk      query    current        rows
------- ------  -------- ---------- ---------- ---------- ----------  ----------
Parse        1      0.00       0.00          0          0          0           0
Execute 100000     41.03      40.49          1       3272     515757      100000
Fetch        0      0.00       0.00          0          0          0           0
------- ------  -------- ---------- ---------- ---------- ----------  ----------
total   100001     41.03      40.50          1       3272     515757      100000

Misses in library cache during parse: 1
Misses in library cache during execute: 1
Optimizer mode: ALL_ROWS
Parsing user id: 103     (recursive depth: 1)
Number of plan statistics captured: 1

Rows (1st) Rows (avg) Rows (max)  Row Source Operation
---------- ---------- ----------  ---------------------------------------------------
         0          0          0  LOAD TABLE CONVENTIONAL  (cr=783 pr=7 pw=0 time=195740 us)


Elapsed times include waiting on following events:
  Event waited on                             Times   Max. Wait  Total Waited
  ----------------------------------------   Waited  ----------  ------------
  Disk file operations I/O                        6        0.00          0.00
  db file sequential read                         3        0.00          0.00
  latch: shared pool                              8        0.00          0.00
  log file switch (private strand flush incomplete)
                                                  1        0.01          0.01
  control file sequential read                   20        0.00          0.00
  Data file init write                           12        0.00          0.00
  db file single write                            1        0.00          0.00
  control file parallel write                     3        0.00          0.00
  rdbms ipc reply                                 1        0.00          0.00
********************************************************************************
After restore point created
SQL ID: dqhz25akp92bp Plan Hash: 0

INSERT INTO SES_LOCK
VALUES
 (DBMS_RANDOM.STRING('x',36))


call     count       cpu    elapsed       disk      query    current        rows
------- ------  -------- ---------- ---------- ---------- ----------  ----------
Parse        1      0.00       0.00          0          0          0           0
Execute 100000     43.42      42.15       3484        660     512898      100000
Fetch        0      0.00       0.00          0          0          0           0
------- ------  -------- ---------- ---------- ---------- ----------  ----------
total   100001     43.43      42.16       3484        660     512898      100000

Misses in library cache during parse: 1
Optimizer mode: ALL_ROWS
Parsing user id: 103     (recursive depth: 1)
Number of plan statistics captured: 1

Rows (1st) Rows (avg) Rows (max)  Row Source Operation
---------- ---------- ----------  ---------------------------------------------------
         0          0          0  LOAD TABLE CONVENTIONAL  (cr=226 pr=0 pw=0 time=56775 us)


Elapsed times include waiting on following events:
  Event waited on                             Times   Max. Wait  Total Waited
  ----------------------------------------   Waited  ----------  ------------
  Disk file operations I/O                        2        0.00          0.00
  db file sequential read                      3484        0.28          0.47
  log file switch (checkpoint incomplete)         1        0.01          0.01
  log file switch completion                      1        0.01          0.01
********************************************************************************
All the waits were on the undo tablespace same as before.

Update 14 July 2014
Same behavior is also observed on 11.2.0.4. Before guarantee restore point
SQL ID: dqhz25akp92bp Plan Hash: 0

INSERT INTO SES_LOCK
VALUES
 (DBMS_RANDOM.STRING('x',36))


call     count       cpu    elapsed       disk      query    current        rows
------- ------  -------- ---------- ---------- ---------- ----------  ----------
Parse        1      0.01       0.01          0          0          0           0
Execute 100000     72.74      81.65          6       3595     426842      100000
Fetch        0      0.00       0.00          0          0          0           0
------- ------  -------- ---------- ---------- ---------- ----------  ----------
total   100001     72.75      81.66          6       3595     426842      100000

Misses in library cache during parse: 1
Misses in library cache during execute: 1
Optimizer mode: ALL_ROWS
Parsing user id: 50     (recursive depth: 1)
Number of plan statistics captured: 1

Rows (1st) Rows (avg) Rows (max)  Row Source Operation
---------- ---------- ----------  ---------------------------------------------------
         0          0          0  LOAD TABLE CONVENTIONAL  (cr=164 pr=8 pw=0 time=103136 us)


Elapsed times include waiting on following events:
  Event waited on                             Times   Max. Wait  Total Waited
  ----------------------------------------   Waited  ----------  ------------
  enq: IV -  contention                          10        0.00          0.00
  db file sequential read                         6        0.00          0.02
  Disk file operations I/O                        1        0.00          0.00
  row cache lock                                  7        0.00          0.00
  latch: shared pool                              4        0.00          0.00
  latch: enqueue hash chains                      3        0.00          0.00
  latch free                                      3        0.00          0.00
  latch: redo allocation                          1        0.00          0.00
  log file switch (checkpoint incomplete)         1        0.00          0.00
  log file switch completion                      1        0.00          0.00
********************************************************************************
After guarantee restore point created
SQL ID: dqhz25akp92bp Plan Hash: 0

INSERT INTO SES_LOCK
VALUES
 (DBMS_RANDOM.STRING('x',36))


call     count       cpu    elapsed       disk      query    current        rows
------- ------  -------- ---------- ---------- ---------- ----------  ----------
Parse        1      0.00       0.00          0          0          0           0
Execute 100000     82.15      94.40       5143       3615     434964      100000
Fetch        0      0.00       0.00          0          0          0           0
------- ------  -------- ---------- ---------- ---------- ----------  ----------
total   100001     82.16      94.41       5143       3615     434964      100000

Misses in library cache during parse: 1
Optimizer mode: ALL_ROWS
Parsing user id: 50     (recursive depth: 1)
Number of plan statistics captured: 1

Rows (1st) Rows (avg) Rows (max)  Row Source Operation
---------- ---------- ----------  ---------------------------------------------------
         0          0          0  LOAD TABLE CONVENTIONAL  (cr=5 pr=3 pw=0 time=13633 us)


Elapsed times include waiting on following events:
  Event waited on                             Times   Max. Wait  Total Waited
  ----------------------------------------   Waited  ----------  ------------
  row cache lock                                  3        0.00          0.00
  Disk file operations I/O                        3        0.00          0.00
  db file sequential read                      5143        0.52          2.31
  KSV master wait                                 2        0.00          0.00
  ASM file metadata operation                     1        0.00          0.00
  latch free                                      1        0.00          0.00
  log file switch (checkpoint incomplete)         2        0.01          0.02
********************************************************************************
Update 21 November 2014
Final reply from Oracle "this is not a bug but expected behavior when restore point is in use".

Monday, October 1, 2012

Log File Sync and Log File Parallel Write Waits

On a routine database health check it was discovered the that the log file sync waits events have increased 10-20 times than the base line values. Graphs generated with ADMon
Log File Sync Waits
Metalink note 34592.1 list the usual causes for high log file sync waits. Assuming all else (meaning hardware related parameters) remains the same and constants the main reason is the high user commit rates. But in this case the user commit rates were consistent throughout the problem period.
User Commits
Same was true for user rollbacks (the drop is due to instance restart) and transaction rollbacks.
User Rollbacks
Transaction Rollback
DB CPU was also consistent throughout the problem period which indicated there was no increase in the system load.
DB CPU
Metalink note 34592.1 show how the log file sync wait time could be broken down. Two metrics related to this case are the "redo write time" metric which is the time taken by lgwr process gathering redo to be written and issuing IO. The second statistic is the log file parallel write (refer 34583.1) wait time which is the "time taken for all the outstanding I/O requests to complete". Log file parallel write wait time graph was similar to the log file sync wait time graph.
Log File Parallel Write
34592.1 also mention several statistics that are related to lgwr performance. These are redo writes,redo blocks written,redo write time,redo wastage and redo size. Definitions of these statistics are from the Oracle Reference guide.
Redo writes is the total number of writes by LGWR to the redo log files and it was also consistent throughout the problem period.
Redo Writes
Redo blocks written is the total number of redo blocks written and it is also consistent and hold the same pattern as before the problem period.
Redo Blocks Written
Redo write time is the total elapsed time of the write from the redo log buffer to the current redo log file in 10s of milliseconds. There a increase in redo write time corresponding to log file sync and log file parallel write graphs indicating more time spent on writing redo to log file.
Redo Write Time
Redo wastage is the number of bytes wasted because redo blocks needed to be written before they are completely full. This statistic was also also consistent throughout the problem period.
Redo Wastage
The last is the redo size which is the total amount of redo generated in bytes. This statistics is also an indication of the system load, if there are more DML then amount of redo size would also increase. However in this case the redo size is also consistent throughout the problem period.
Redo Size
Next redo log space and redo log buffer statistics were looked at. Redo buffer allocation retries are the total number of retries necessary to allocate space in the redo buffer. Though there hasn't been any reduction in redo buffer size the amount of redo buffer allocation retries have gone up indicating lgwr is not clearing the log buffer fast enough.
Redo Buffer Allocation Retries
Redo Buffers
Increase in redo log space requests and redo log space wait time indicates that the wait is not memory bound but IO (or disk) bound. Redo log space requests is the number of times the active log file is full and Oracle must wait for disk space to be allocated for the redo log entries. Increase in this means slow IO. Redo log space wait time is the total elapsed waiting time for "redo log space requests" in 10s of milliseconds. Both these statistics have increased in value over the problem period.
Redo Log Space Requests
Redo Log Space Wait Time
Considering all of the above it seems the traffic is the same (system load, redo generation) but some of the lanes (IO bandwidth) "might be" closed. Looking at the IO time on the OS statistics showed a increased IO time which corresponds with log file sync increase. So the assumption that "all else remains the same" may not be correct.
IO Time
Therefore at this point assumption was that cause for increase in these wait events might be due to "something" in the IO sub system rather than the database or application. The system was a two node cluster using a SAN with RAID 5. Both 34583.1 and 34592.1 advise against placing redo logs on RAID 5 but in this case even with RAID 5 the log file *(sync/parallel write) waits were low. So RAID 5 is not the root cause here.
On further investigating the SAN it was discovered the it had two RAID controllers and battery on one of them has failed (thus closing one lane of traffic).
Replacing the dead battery and bringing the RAID controller online (opening up the lane) made the waits to go back to previous level.
Log File Parallel Write


Below is a different system's log file *(sync/parallel write) waits and in this case the increase in waits is caused by a burst of user commits.
Log File Sync
Log File Parallel Write
User Commits
Increase in these two wait events could happen due to user activity as well as due to change in IO related hardware (partial failure as in this case). Having a base line taken when the performance is optimal, to compare with the problem period could help in diagnosing and identifying the reason for the increase.

Useful metalink notes
WAITEVENT: "log file sync" Reference Note [ID 34592.1]
WAITEVENT: "log file parallel write" Reference Note [ID 34583.1]

Tuesday, August 7, 2012

Variable Length In-Clause : SQL vs PL/SQL Method Comparison

When the number of variables in a in-clause varies this results in a new statement being created. The widely available solution (after some googling) for this is to create a PL/SQL function and use a table type to run the in-clause where only one statement is created and will get re-used irrespective of number of parameters. This is a comparison between these two options of using the PL/SQL method and creating unique SQL for each set of in-clause variables.
For PL/SQL option create a table type and function as below
create or replace type mytabletype as table of number;

create or replace function mytablefun(input in varchar2) return
mytabletype
as 
    l_str   LONG DEFAULT input || ',';
    l_n     NUMBER;
    l_data  mytabletype := mytabletype();
BEGIN
    LOOP
        l_n := instr( l_str, ',' );
        exit when (nvl(l_n,0) = 0);
        l_data.extend;
        l_data( l_data.count ) := ltrim(rtrim(substr(l_str,1,l_n-1)));
        l_str := substr( l_str, l_n+1 );
    END LOOP;
    RETURN l_data;
END;
/
The test case is run using a java program which generate the sql statments. Code is given below
import java.sql.Connection;
import java.sql.PreparedStatement;
import java.sql.ResultSet;
import java.sql.SQLException;

public class InclauseTest {

    public static void main(String[] args)  {
        try {

            //Connection pool creation code eg. OracleDataSource or UDP

            Connection con = pool.getConnection();

            long t1 = System.currentTimeMillis();

            newsqlMehtod(con);       //runs sql method test
//            newfunctionMethod(con);  // uncomment to run pl/sql method test

            long t2 = System.currentTimeMillis();

            DBStats.displayStats(con);


            System.out.println("\n\n total time taken : "+(t2-t1));
            con.close();

        } catch (Exception ex) {
            ex.printStackTrace();
        }
    }


 public static void newsqlMehtod(Connection con){

        String sql1 = "select * from x where a in (";
                        
        for (int i = 0 ; i < 10000; i++){
            
            try {
                int k = i % 10;
                PreparedStatement pr = con.prepareStatement(sql1+prepareStringCreate(k)+")");

                preparePopulate(pr, k+1);


                ResultSet rs = pr.executeQuery();

                while(rs.next()){

                    int q = rs.getInt(1);
                    double p = rs.getDouble(2);
                }

                rs.close();
                pr.close();


            } catch (Exception ex) {
                ex.printStackTrace();
            }
        }
    }

  public static String prepareStringCreate( int i){
        
        StringBuilder x = new StringBuilder("?");

        for(int j = 0; j< i; j++){
            
            x.append(",?");
        }
        
        return x.toString();
        
    }

  public static void preparePopulate(PreparedStatement pr, int i) throws SQLException{

        for(int j = 0; j< i; j++){

            pr.setInt(j+1, (j+1)* 10);
        }

    }

 public static void newfunctionMethod(Connection con){

             String sql = "select * from x where a in (select * from table(SELECT CAST( mytablefun( ? ) AS mytabletype ) FROM dual))";

        for (int i = 0 ; i < 10000; i++){
            try {
                PreparedStatement pr = con.prepareStatement(sql);

               StringBuilder x = new StringBuilder("10");

               int q = i%10;

               for (int j = 0; j<q  ; j++){

                   x.append(","+((j+2)*10));
               }

                
                pr.setString(1, x.toString());
                ResultSet rs = pr.executeQuery();

                while(rs.next()){

                    int k = rs.getInt(1);
                    double p = rs.getDouble(2);
                }

                rs.close();
                pr.close();

            } catch (Exception ex) {
                ex.printStackTrace();
            }
        }

    }
}

import java.sql.Connection;
import java.sql.PreparedStatement;
import java.sql.ResultSet;
import java.sql.SQLException;

public class DBStats {

    public static void displayStats(Connection con) {
        try {
            PreparedStatement pr = con.prepareStatement("select name,value " + "from v$mystat,v$statname " + "where v$mystat.statistic#=v$statname.statistic# " 
//                    + "and v$statname.statistic# in (11,12)"); //11gR1
                    + "and v$statname.statistic# in (16,17)"); //11gR2

            ResultSet rs = pr.executeQuery();


            while(rs.next()){

                System.out.println(rs.getString(1)+" "+rs.getDouble(2));
            }

            rs.close();
            pr.close();
        } catch (SQLException ex) {
            ex.printStackTrace();
        }

    }
}
Running the test case once will result in 10000 sql statements being executed with number of values used in the in-clause varying from 1 - 10. The DBStats class is used to get CPU used by the session values. The java test program is run twice (resulting in 20000 executions) and SQL statistics are taken. Shared pool is flushed before the run but not between each run (so the statistics are cumulative).


First the results from SQL method. The session stats gives
first run
CPU used when call started 47.0
CPU used by this session 49.0

second run
CPU used when call started 43.0
CPU used by this session 43.0
SQL stats
SQL> select sql_id,cpu_time,elapsed_time,executions,SHARABLE_MEM,PERSISTENT_MEM,RUNTIME_MEM,
sql_text from v$sql where sql_text like 'select * from x where a in%' order by sql_text;

SQL_ID          CPU_TIME ELAPSED_TIME EXECUTIONS SHARABLE_MEM PERSISTENT_MEM RUNTIME_MEM SQL_TEXT
------------- ---------- ------------ ---------- ------------ -------------- ----------- ----------------------------------------------------------------------
26fb47dhnuz88      28994        94332       2000        19753           4496        3408 select * from x where a in (:1 )
068anap1mvbdx      46993       105790       2000        15701           4648        3528 select * from x where a in (:1 ,:2 )
387t0d508fkzb      55993       107300       2000        19777           4728        3576 select * from x where a in (:1 ,:2 ,:3 )
3hm2vcm9q6zup      35994       108100       2000        19797           4808        3624 select * from x where a in (:1 ,:2 ,:3 ,:4 )
7fg42cswna64p      55992       107610       2000        19825           4888        3672 select * from x where a in (:1 ,:2 ,:3 ,:4 ,:5 )
89k5ysfx65zpu      52992       109258       2000        19845           4968        3720 select * from x where a in (:1 ,:2 ,:3 ,:4 ,:5 ,:6 )
32w3mnqx0vhf4      40994       109297       2000        19865           5048        3768 select * from x where a in (:1 ,:2 ,:3 ,:4 ,:5 ,:6 ,:7 )
4yxvar786t71u      63987       110639       2000        19885           5128        3816 select * from x where a in (:1 ,:2 ,:3 ,:4 ,:5 ,:6 ,:7 ,:8 )
7x0jrn3nj8ux6      54987       112536       2000        19913           5208        3864 select * from x where a in (:1 ,:2 ,:3 ,:4 ,:5 ,:6 ,:7 ,:8 ,:9 )
0z3udxfqg2p0p      57998       112400       2000        19942           5288        3912 select * from x where a in (:1 ,:2 ,:3 ,:4 ,:5 ,:6 ,:7 ,:8 ,:9 ,:10 )

10 rows selected.
As expected the SQL method results in 10 statements being created and each getting equal number of executions. Stats for each executions, although elapsed time per exec is roughly same CPU time values vary.
SQL> SELECT sql_id,
  2    cpu_time,
  3    round(cpu_time/executions,2) as cpu_per_exec,
  4    elapsed_time,
  5    round(elapsed_time/executions,2) as ela_per_exec,
  6    executions,
  7  --  SHARABLE_MEM,
  8  --    PERSISTENT_MEM,
  9  --  RUNTIME_MEM,
 10    sql_text
 11  FROM v$sql
 12  WHERE sql_text LIKE 'select * from x where a in%'
 13  ORDER BY sql_text;

SQL_ID        CPU_TIME CPU_PER_EXEC ELAPSED_TIME ELA_PER_EXEC EXECUTIONS SQL_TEXT
------------- -------- ------------ ------------ ------------ ---------- ---------------------------------------------------------------------
26fb47dhnuz88    28994         14.5        94332        47.17       2000 select * from x where a in (:1 )
068anap1mvbdx    46993         23.5       105790         52.9       2000 select * from x where a in (:1 ,:2 )
387t0d508fkzb    55993           28       107300        53.65       2000 select * from x where a in (:1 ,:2 ,:3 )
3hm2vcm9q6zup    35994           18       108100        54.05       2000 select * from x where a in (:1 ,:2 ,:3 ,:4 )
7fg42cswna64p    55992           28       107610        53.81       2000 select * from x where a in (:1 ,:2 ,:3 ,:4 ,:5 )
89k5ysfx65zpu    52992         26.5       109258        54.63       2000 select * from x where a in (:1 ,:2 ,:3 ,:4 ,:5 ,:6 )
32w3mnqx0vhf4    40994         20.5       109297        54.65       2000 select * from x where a in (:1 ,:2 ,:3 ,:4 ,:5 ,:6 ,:7 )
4yxvar786t71u    63987        31.99       110639        55.32       2000 select * from x where a in (:1 ,:2 ,:3 ,:4 ,:5 ,:6 ,:7 ,:8 )
7x0jrn3nj8ux6    54987        27.49       112536        56.27       2000 select * from x where a in (:1 ,:2 ,:3 ,:4 ,:5 ,:6 ,:7 ,:8 ,:9 )
0z3udxfqg2p0p    57998           29       112400         56.2       2000 select * from x where a in (:1 ,:2 ,:3 ,:4 ,:5 ,:6 ,:7 ,:8 ,:9 ,:10 )
Next is the PL/SQL method, again java program is run twice and shared pool is flushed before the run but not between the runs. The session stats gives
first run
CPU used when call started 479.0
CPU used by this session 481.0

second run
CPU used when call started 267.0
CPU used by this session 267.0
CPU used by session is high compared to the SQL statement method earlier. The sql stats
SQL_ID          CPU_TIME ELAPSED_TIME EXECUTIONS SHARABLE_MEM PERSISTENT_MEM RUNTIME_MEM SQL_TEXT
------------- ---------- ------------ ---------- ------------ -------------- ----------- ----------------------------------------------------------------------
1p40d61qp4u6g    6333007      7284060      19997        28748           7040        5328 select * from x where a in (select * from table(SELECT CAST( mytablefu
                                                                                         n( :1  ) AS mytabletype ) FROM dual))

1p40d61qp4u6g      91986        91943          3        28748           7040        5328 select * from x where a in (select * from table(SELECT CAST( mytablefu
                                                                                         n( :1  ) AS mytabletype ) FROM dual))
Per exec values
SQL_ID            CPU_TIME CPU_PER_EXEC ELAPSED_TIME ELA_PER_EXEC EXECUTIONS SQL_TEXT
------------- ------------ ------------ ------------ ------------ ---------- ---------------------------------------------------------------------
1p40d61qp4u6g      6333007        316.7      7284060       364.26      19997 select * from x where a in (select * from table(SELECT CAST( mytablef
                                                                             un( :1  ) AS mytabletype ) FROM dual))

1p40d61qp4u6g        91986        30662        91943     30647.67          3 select * from x where a in (select * from table(SELECT CAST( mytablef
                                                                             un( :1  ) AS mytabletype ) FROM dual))
First some clarification as to why there are two sets of statments when only one is expected. Looking at the sql shared view
SQL> SELECT sql_id,
  2  child_number,
  3  address,
  4  executions,sql_text
  5  FROM v$sql
  6  WHERE sql_text LIKE 'select * from x where a in%'
  7  ORDER BY sql_text;

SQL_ID        CHILD_NUMBER ADDRESS          EXECUTIONS SQL_TEXT
------------- ------------ ---------------- ---------- ----------------------------------------------------------------------
1p40d61qp4u6g            1 00000002088B14D0      19997 select * from x where a in (select * from table(SELECT CAST( mytablefu
                                                       n( :1  ) AS mytabletype ) FROM dual))

1p40d61qp4u6g            0 00000002088B14D0          3 select * from x where a in (select * from table(SELECT CAST( mytablefu
                                                       n( :1  ) AS mytabletype ) FROM dual))
                
                
SQL> select sql_id,address,child_number,use_feedback_stats from V$SQL_SHARED_CURSOR where sql_id='1p40d61qp4u6g'  and address='00000002088B14D0';

SQL_ID        ADDRESS          CHILD_NUMBER USE_FEEDBACK_STATS
------------- ---------------- ------------ --------------------
1p40d61qp4u6g 00000002088B14D0            0 Y
1p40d61qp4u6g 00000002088B14D0            1 N
"Y" on use_feedback_stats means "A hard parse is forced so that the optimizer can reoptimize the query with improved cardinality estimates" (From Oracle docs).

The comparison is made on cpu time and shareable memory. First the cpu time comparison
Sum of cpu time from the SQL method test = 494924
Sum of cpu time from the PL/SQL method test = 6424993
It could be seen that PL/SQL method uses over 1198% more CPU time than the SQL method.

Comparing the shareable memory used by two methods
Sum of shareable memory from SQL method test = 194303
Sum of shareable memory from PL/SQL method test = 57496
It could be seen due to creation of multiple statements SQL method uses 238% more shareable memory than the PL/SQL method.

The comparison shows the two methods have trade-off between cpu and memory.