| Case 1 | Vs | Case 2 | |
Create PreparedStatement
  For Loop
    bind values
    execute
  End Loop
Close PreparedStatement | For Loop Create PreparedStatemnt bind values execute Close PreparedStatement End Loop | ||
From a developer's perspective it could be answered that first code only creates one preparedstatement and uses is multiple times and close it once whereas the second one creates create and close a preparedstatement with each iteration incurring additional overhead as such first code is better. What about the oracle perspective? would there be multiple parses on the second code? will it incur additional database resources? Looking at the trkprof output will have the following for these codes (java code used is given at the end of the post)
| Case 1 | Vs | Case 2 | |
call count ------- ------ Parse 1 Execute 1000 Fetch 1000 ------- ------ total 2001 | call count ------- ------ Parse 1000 Execute 1000 Fetch 1000 ------- ------ total 3000 | ||
Tkprof output shows second code resulted in 1000 parses while first only had one parse so again first code must be better(?). The answer is yes the first set of code is better but not because it does less parses than the second code. If session cached cursors parameter is set to a value other than 0 (default 50) and cursor (or sql in the preparedstatement) is cached then the number of actual parses are exactly the same for both set of codes. Any performance loss on the second code set is due to session cache look up not due to parsing.
Cursor access could be ordered in following way when it comes to how fast they could be accessed.
1. Finding an open cursor in the session cache. Does not require parsing, not even soft.
2. Finding a close cursor in the session cache. Does not require parsing, not event soft.
3. Finding the cursor in the shared pool. Results in soft parse.
4. Constructing the cursor from scratch. Results in hard parse.
For more detail information refer Oracle performance tuning student guide Chapter 9, section cursor usage and parsing.
The java code used for testing is given at the end of the post. In the java code SQL1 denotes the "business" SQL. SQL2 is used to get the session statistics (total and hard parses, number of session cached cursors and session cache hits). SQL3 list all the open cursors in the session. Java code checks out a single connection from the UCP and execute the entire test case before closing it. Therefore statistics could be calculated comparing values at the time of connection checkout and at the time of connection close.
First set of test cases are run with session cached cursors parameters set to 50 (default). Run the java code several times until the hard parse count is 0 when connection is taken from the connection pool. Test begins from this point onwards. Executing the test case 1 (comment the code related to case 2 in the java code) will give an output similar to below.
start got connection
1 select /*+ connect_by_filtering */ privilege#,level from sys   DICTIONARY LOOKUP CURSOR CACHED   SYS    34
2 insert into sys.aud$( sessionid,entryid,statement,ntimestamp   OPEN-RECURSIVE                    ASANGA 34
3 select value$ from props$ where name = 'GLOBAL_DB_NAME'        DICTIONARY LOOKUP CURSOR CACHED   SYS    34
4 select SYS_CONTEXT('USERENV', 'SERVER_HOST'), SYS_CONTEXT('U   DICTIONARY LOOKUP CURSOR CACHED   SYS    34
5 select decode(failover_method, NULL, 0 , 'BASIC', 1, 'PRECON   DICTIONARY LOOKUP CURSOR CACHED   SYS    34
6 select privilege# from sysauth$ where (grantee#=:1 or grante   DICTIONARY LOOKUP CURSOR CACHED   SYS    34
7 select rownum,sql_text,cursor_type,USER_NAME,sid from v$open   OPEN                              ASANGA 34

Parse_Total Hard_Parse Ses_Cur_Cache_Hit Ses_Cur_Cache_Count CPU
        9         0         0                 7               5
end got connection

start execute
1 select * from (SELECT name,  value FROM v$sesstat,  v$statna   DICTIONARY LOOKUP CURSOR CACHED   ASANGA 34
2 select /*+ connect_by_filtering */ privilege#,level from sys   DICTIONARY LOOKUP CURSOR CACHED   SYS    34
3 insert into sys.aud$( sessionid,entryid,statement,ntimestamp   OPEN-RECURSIVE                    ASANGA 34
4 select value$ from props$ where name = 'GLOBAL_DB_NAME'        DICTIONARY LOOKUP CURSOR CACHED   SYS    34
5 select SYS_CONTEXT('USERENV', 'SERVER_HOST'), SYS_CONTEXT('U   DICTIONARY LOOKUP CURSOR CACHED   SYS    34
6 select decode(failover_method, NULL, 0 , 'BASIC', 1, 'PRECON   DICTIONARY LOOKUP CURSOR CACHED   SYS    34
7 select privilege# from sysauth$ where (grantee#=:1 or grante   DICTIONARY LOOKUP CURSOR CACHED   SYS    34
8 select b from x where a = :1                                   DICTIONARY LOOKUP CURSOR CACHED   ASANGA 34
9 select rownum,sql_text,cursor_type,USER_NAME,sid from v$open   DICTIONARY LOOKUP CURSOR CACHED   ASANGA 34

Parse_Total Hard_Parse Ses_Cur_Cache_Hit Ses_Cur_Cache_Count CPU
        10         0         2                 9              93
end execute
Output of SQL3 list the row number, sql text of the cursor, cursor type and the username and finally the SID. It's interesting that Oracle reference doc says for v$open_cursor the username refers to "User that is logged in to the session" still some cursors list username as sys while the session id is of current session which is of user asanga. The second output (from SQL2) list total parses, hard parses, session cache cursor hits and session cache cursor count and CPU used by the session.Looking at the output at the time of the connection checkout the session (or JDBC connection) had done 9 parses (soft) as there are 0 hard parses listed. It has 7 cursors in it's session cache and no session cache cursor hits and so far has used 5 CPU centi-seconds. The 7 cursors and their types are also listed. What's missing from this initial output is the SQL2 as it has not been run when the session cursor content was listed. But once the SQL2 is executed and cursor is closed that too will be added as a session cached cursor.
After executing the test case the total parse count is increased to 10 but as there are no hard parses , the additional parse is a soft parse. However during this period at least 3 different SQLs were executed (SQL1,SQL2 and SQL3) and SQL1 had multiple executions as well. Yet only one soft parse has resulted during this time. There are two session cache cursor hits, these are as a result of running SQL2 and SQL3 as they had already been cached. So the additional parse is for SQL1 and even though it was run 10000 times it resulted only in one soft parse (as show in the trace file output listed earlier). This shows that finding an open cursor in the session does not result in soft parses when the cursor is used for multiple executions. Total CPU usage for the test case 1 is 88 (93-5).
To run the test case 2 uncomment the case 2 section and comment the case 1 section. Output for this test case is shown below.
start got connection
1 select /*+ connect_by_filtering */ privilege#,level from sys        DICTIONARY LOOKUP CURSOR CACHED   SYS    34
2 insert into sys.aud$( sessionid,entryid,statement,ntimestamp        OPEN-RECURSIVE                    ASANGA 34
3 select value$ from props$ where name = 'GLOBAL_DB_NAME'             DICTIONARY LOOKUP CURSOR CACHED   SYS    34
4 select SYS_CONTEXT('USERENV', 'SERVER_HOST'), SYS_CONTEXT('U        DICTIONARY LOOKUP CURSOR CACHED   SYS    34
5 select decode(failover_method, NULL, 0 , 'BASIC', 1, 'PRECON        DICTIONARY LOOKUP CURSOR CACHED   SYS    34
6 select privilege# from sysauth$ where (grantee#=:1 or grante        DICTIONARY LOOKUP CURSOR CACHED   SYS    34
7 select rownum,sql_text,cursor_type,USER_NAME,sid from v$open        OPEN                              ASANGA 34

Parse_Total Hard_Parse Ses_Cur_Cache_Hit Ses_Cur_Cache_Count CPU
        9         0         0                 7               6
end got connection

start execute
1 select * from (SELECT name,  value FROM v$sesstat,  v$statna        DICTIONARY LOOKUP CURSOR CACHED   ASANGA 34
2 select /*+ connect_by_filtering */ privilege#,level from sys        DICTIONARY LOOKUP CURSOR CACHED   SYS    34
3 insert into sys.aud$( sessionid,entryid,statement,ntimestamp        OPEN-RECURSIVE                    ASANGA 34
4 select value$ from props$ where name = 'GLOBAL_DB_NAME'             DICTIONARY LOOKUP CURSOR CACHED   SYS    34
5 select SYS_CONTEXT('USERENV', 'SERVER_HOST'), SYS_CONTEXT('U        DICTIONARY LOOKUP CURSOR CACHED   SYS    34
6 select decode(failover_method, NULL, 0 , 'BASIC', 1, 'PRECON        DICTIONARY LOOKUP CURSOR CACHED   SYS    34
7 select privilege# from sysauth$ where (grantee#=:1 or grante        DICTIONARY LOOKUP CURSOR CACHED   SYS    34
8 select b from x where a = :1                                        SESSION CURSOR CACHED             ASANGA 34
9 select rownum,sql_text,cursor_type,USER_NAME,sid from v$open        DICTIONARY LOOKUP CURSOR CACHED   ASANGA 34

Parse_Total Hard_Parse Ses_Cur_Cache_Hit Ses_Cur_Cache_Count CPU
        10         0         10001             9             151
end execute
The statistics values at connection checkout are identical to that of case 1. The test case output shows the total parse count increased by 1. This is same as case 1, even though in case 2 preparedstatement was created and closed with each iteration this has not resulted in additional parses. The reason for this is that a closed cursor was found in the session cache and resulted in a session cache cursor hit. This value is 10001 in the second test case. From the test case 1 it's known that SQL2 and SQL3 results in 2 session cache hits. This means SQL1 resulted in 9999 session cache hits when executing 10000 times. The one cache hit miss, the initial execution resulted in a single soft parse. Thus in terms number of parses done case 1 and case 2 are the same. However a tkprof output would list 10000 parses which is not necessarily the case. The total session cursor count is 9 same as test case 1 but the CPU time is high compared to previous test case and is at 145 (151-6) centi-seconds. This is the overhead of session cache cursor look up.What would be the parse overhead for two cases when the session cached cursor parameter is set to 0. This would mean no cursors would be found in the session cache. Below is the output for case 1 when run with session cache cursor set to 0.
start got connection
1 insert into sys.aud$( sessionid,entryid,statement,ntimestamp        OPEN-RECURSIVE  ASANGA  157
2 select rownum,sql_text,cursor_type,USER_NAME,sid from v$open        OPEN            ASANGA  157

Parse_Total Hard_Parse Ses_Cur_Cache_Hit Ses_Cur_Cache_Count CPU
        9         0         0                 0               3
end got connection

start execute
1 insert into sys.aud$( sessionid,entryid,statement,ntimestamp        OPEN-RECURSIVE  ASANGA  157
2 select rownum,sql_text,cursor_type,USER_NAME,sid from v$open        OPEN            ASANGA  157

Parse_Total Hard_Parse Ses_Cur_Cache_Hit Ses_Cur_Cache_Count CPU
        12         0         0                 0              74
end execute
Number of parses at the connection checkout time is same as the test executed with SCC (session_cached_curosr) = 50. However there are no session cached cursors only opened ones. At the end of the execution total number of parses increased by 3. This is due to execution of SQL1, SQL2 and SQL3. Even though SQL1 was executed multiple times with same cursor (or preparedstatement) it only resulted in one soft parse which is same as test case 1 with SCC=50. Since there's no session cache SQL2 and SQL3 executed second time around also results in soft parses. The total CPU usage is 71 (74-3) centi-seconds which less compared to test 1 with SCC=50.Output for test case 2 with SCC=0 is shown below.
start got connection
1 insert into sys.aud$( sessionid,entryid,statement,ntimestamp        OPEN-RECURSIVE   ASANGA  157
2 select rownum,sql_text,cursor_type,USER_NAME,sid from v$open        OPEN             ASANGA  157

Parse_Total Hard_Parse Ses_Cur_Cache_Hit Ses_Cur_Cache_Count CPU
        9         0         0                 0               3
end got connection

start execute
1 insert into sys.aud$( sessionid,entryid,statement,ntimestamp        OPEN-RECURSIVE   ASANGA  157
2 select rownum,sql_text,cursor_type,USER_NAME,sid from v$open        OPEN             ASANGA  157

Parse_Total Hard_Parse Ses_Cur_Cache_Hit Ses_Cur_Cache_Count CPU
   10011         0           0                0              198
end execute
Compared to previous case 1 there's a huge increase in the amount of soft parses. Total parse count was increased by 10002 (10011-9). This is as a result of 10000 parses for SQL1 and 1 parse each for SQL2 and SQL3. As a result the CPU usage has also increased which is 195 (198-3) centi-seconds for case 2. So out of all scenarios case 2 with SCC=0 would be the worse in terms of parse overhead and CPU.It is possible to enable statement caching on the JDBC connection pool/non-pooled physical connection as opposed to database session cache. This is useful to lower the CPU and parse overhead when SCC=0 and there's no way to set SCC initialization parameter. This could be tested in the java code by uncommenting the setMaxStatements line. Below is the output for test case 2 with setMaxStatements value set to 10.
start got connection
1 insert into sys.aud$( sessionid,entryid,statement,ntimestamp        OPEN-RECURSIVE   ASANGA   157
2 select rownum,sql_text,cursor_type,USER_NAME,sid from v$open        OPEN             ASANGA   157

Parse_Total Hard_Parse Ses_Cur_Cache_Hit Ses_Cur_Cache_Count CPU
        9         0         0                 0               3
end got connection

start execute
1 select * from (SELECT name,  value FROM v$sesstat,  v$statna        OPEN             ASANGA  157
2 insert into sys.aud$( sessionid,entryid,statement,ntimestamp        OPEN-RECURSIVE   ASANGA  157
3 select b from x where a = :1                                        OPEN             ASANGA  157
4 select rownum,sql_text,cursor_type,USER_NAME,sid from v$open        OPEN             ASANGA  157

Parse_Total Hard_Parse Ses_Cur_Cache_Hit Ses_Cur_Cache_Count CPU
        10         0         0                 0             107
end execute
In this case the total parse count was only increased by 1 and CPU usage is low compared to test case 2 with SCC=0. This comparable to test cases with SCC=50 in terms CPU usage and parse count.The parse counts and CPU usage for each test case could be summarized as below. SCC is session cached cursor value and MaxStm is the value set on setMaxStatements method.
| Test | Parse count | CPU (centi-seconds) |
|---|---|---|
| SCC=50,Case=1,MaxStm=0 | 1 | 88 |
| SCC=50,Case=2,MaxStm=0 | 1 | 145 |
| SCC=0,Case=1,MaxStm=0 | 3 | 71 |
| SCC=0,Case=2,MaxStm=0 | 10002 | 195 |
| SCC=0,Case=1,MaxStm=10 | 1 | 97 |
| SCC=0,Case=2,MaxStm=10 | 1 | 104 |
CPU usage graph shown below.
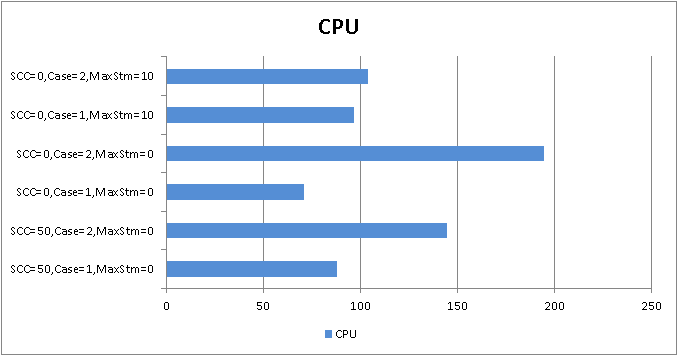
Tests has shown that setting or not setting session cached cursor parameter has a higher degree of influence in terms of parse count when comparing case 1 and case 2. When session cached cursor is not set statement caching could be achieved with the help of connection pools and in terms of parse count this is comparable to scenario with session cached cursor set.
Table used for test
create table x (a number, b varchar2(10));

begin
  for i in 1 .. 10
  loop
  insert into x values (i, 'abc'||i);
  end loop;
end;
/
Java code used for test
import java.sql.Connection;
import java.sql.PreparedStatement;
import java.sql.ResultSet;
import java.sql.SQLException;
import java.util.logging.Level;
import java.util.logging.Logger;

import oracle.ucp.jdbc.PoolDataSource;
import oracle.ucp.jdbc.PoolDataSourceFactory;

/**
 *
 * @author Asanga
 */
public class CursorTest {

    static String SQL1 = "select b from x where a = ?";
    static String SQL2 = "select * from (SELECT name,  value FROM v$sesstat,  v$statname WHERE v$sesstat.statistic#=v$statname.statistic# "
            + "AND (v$statname.name in ('parse count (total)','parse count (hard)','session cursor cache hits','session cursor cache count','CPU used by this session'))"
            + " AND v$sesstat.sid= sys_context('USERENV','SID')"
            + " )pivot (sum(value) for name in ('parse count (total)' as Parse_Total,'parse count (hard)' Hard_Parse,'session cursor cache hits' as SES_CUR_CACHE_HITS,'session cursor cache count' as SES_CUR_CACHE_COUNT, 'CPU used by this session' as CPU))";
    static String SQL3 = "select rownum,sql_text,cursor_type,USER_NAME,sid from v$open_cursor where sid=sys_context('USERENV','SID')";

    public static void main(String[] args) throws Exception {
        try {

            PoolDataSource ds = PoolDataSourceFactory.getPoolDataSource();
            ds.setConnectionFactoryClassName("oracle.jdbc.pool.OracleDataSource");
            ds.setConnectionPoolName("TTPool");
            ds.setURL("jdbc:oracle:thin:@192.168.0.93:1521/dbsrv1");
            ds.setUser("asanga");
            ds.setPassword("asa");
//            ds.setMaxStatements(10);

            Connection con = ds.getConnection();
            PreparedStatement pr = null;

            System.out.println("start got connection");
            stat(con);
            System.out.println("end got connection");

            System.out.println("start execute");
            ResultSet rs = null;

            /****************************** Start CASE 1 ************************************/
            pr = con.prepareStatement(SQL1);
            for (int i = 0; i < 10000; i++) {
                pr.setInt(1, i % 10);
                rs = pr.executeQuery();

                while (rs.next()) {
                    rs.getString(1);
                }
                rs.close();
            }

            pr.close();
            /****************************** End CASE 1 ************************************/
            /****************************** Start CASE 2 ************************************/
//            for (int i = 0; i < 10000; i++) {
//                pr = con.prepareStatement(SQL1);
//                pr.setInt(1, i%10);
//                rs = pr.executeQuery();
//
//                while (rs.next()) {
//                    rs.getString(1);
//                }
//                rs.close();
//                pr.close();
//            }
            /****************************** End CASE 2 ************************************/
            stat(con);
            System.out.println("end execute");
            con.close();

        } catch (SQLException ex) {
            Logger.getLogger(CursorTest.class.getName()).log(Level.SEVERE, null, ex);
        }
    }

    public static void stat(Connection con) throws SQLException {

        PreparedStatement pr = null;
        ResultSet rs = null;

        pr = con.prepareStatement(SQL3);
        rs = pr.executeQuery();
        while (rs.next()) {
            System.out.println(rs.getString(1) + " " + rs.getString(2) + "\t" + rs.getString(3) + " " + rs.getString(4) + " " + rs.getString(5));
        }
        rs.close();
        pr.close();

        System.out.println("Parse_Total Hard_Parse Ses_Cur_Cache_Hit Ses_Cur_Cache_Count CPU");
        pr = con.prepareStatement(SQL2);
        rs = pr.executeQuery();

        while (rs.next()) {

            System.out.println("\t" + rs.getString(1) + "\t " + rs.getInt(2) + "\t " + rs.getString(3) + "\t\t " + rs.getInt(4) + "\t       " + rs.getInt(5));
        }

        rs.close();
        pr.close();

    }
}
Related Post
Session Cached Cursors and JDBC CallableStatement