Before enabling DB management there are few pre-req steps that must be completed. DB managment service uses private endpoint to establish connection to the DB. This private endpoint is different to the private endpoint used for data safe. Infact any private endpoints created for data safe won't be visible in the drop down list of the enable DB management window. Therefore, create a database management specific endpoint via Observability & Management -> Administration (under Database Management) -> Private Endpoints.


As the next allow the network where private endpoint reside to communicate with the network where the database reside. Allowing ingress and egress access on port 1521 for private endpoint network is the easiest way to accomplish this. Below is the entries added to the security list associated with the subnet used for database.

Database management need a username and password to connect to the database. The password used must be stored in an OCI vault. The database management service access the vault and get the password to connect to the database. For this case the password for dbsnmp user is stored in the vault secrets and called dbsnmp_secret.

Also connected to vault, the DB managemnt service called "dpd" must granted permission to access the secret in the vault. This could be done by creating a policy which allows dpd service to access the vault.

DBCS VM DB has dbsnmp user precreated as a common user. But the account is in locked status. Unlock the user account and grant following privileges and roles. In this case dbsnmp is used. It is possible to use a different user as well.
alter user dbsnmp account unlock;
alter user dbsnmp identified by pwd_here;

GRANT CREATE PROCEDURE TO dbsnmp container=all;
GRANT SELECT ANY DICTIONARY, SELECT_CATALOG_ROLE TO dbsnmp container=all;
GRANT ALTER SYSTEM TO dbsnmp container=all;
GRANT ADVISOR TO dbsnmp container=all;
GRANT EXECUTE ON DBMS_WORKLOAD_REPOSITORY TO dbsnmp container=all;
That concludes the pre-reqs.
The documentation states that certain features are not available on PDBs but testing showed otherwise.

It could be that documentation is not updated with the latest capabilities and features).
Enabling of DB management could be done via Observability & Management -> Administration (under Database Management) or clicking the enable button in the database detail page.

This will open the enable database management dialog and will be pre-filled with details of the database. By default the service name is populated with the service name of the cdb$root (however, it is possible give the service name of the PDB as well and enabling DB managment at PDB level.

The main consideration is which option to choose. Full management gives lot more capabilities at a cost whereas basic appears to be free.

Once the enable database managment button is clicked, montior the enabling of database management via work requests.

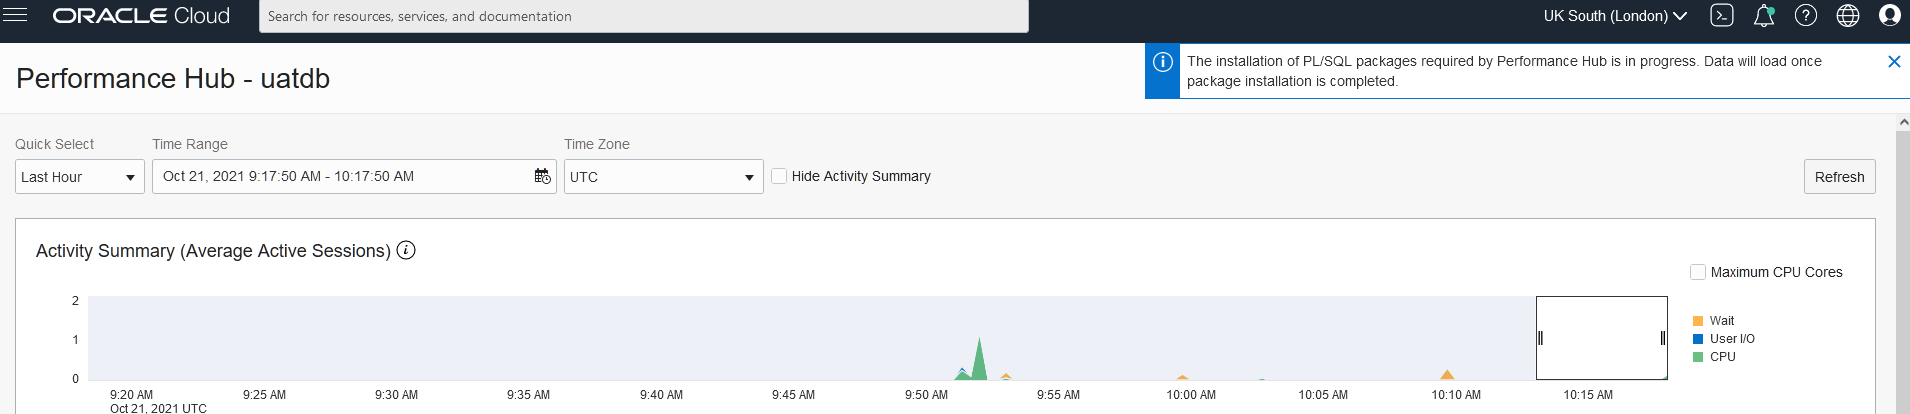
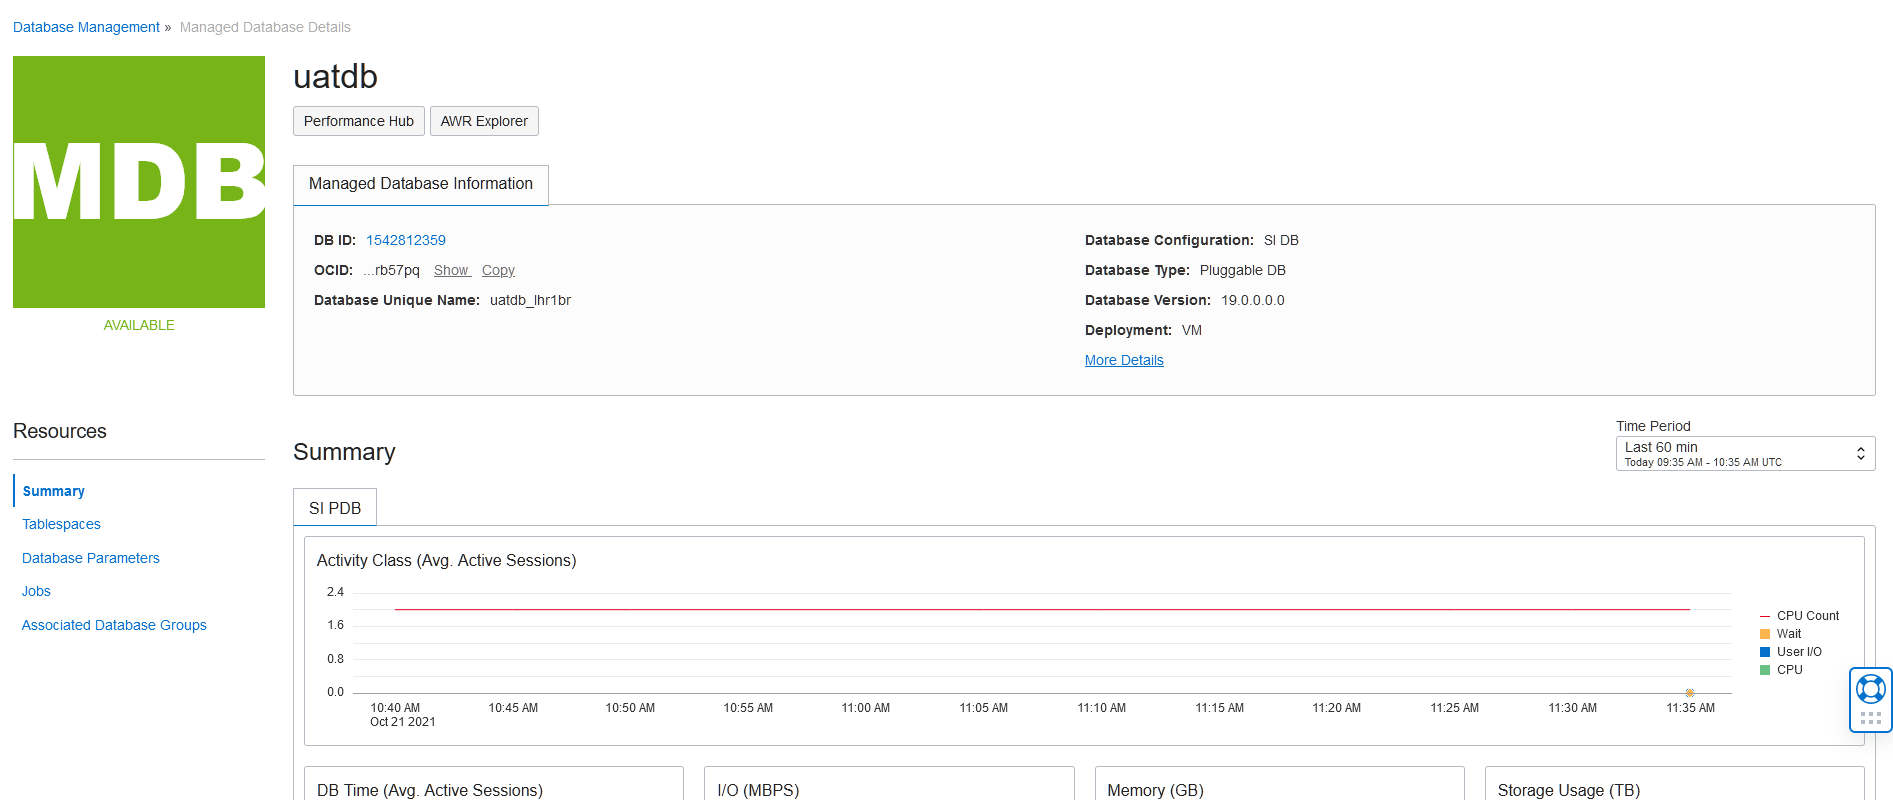
Once enabled, the DB management will populate the metrics charts.

The DB Management service will automatically install necessary PL/SQL packages needed the very first time performance hub is used. This is not done in subsequent uses of performance hub.
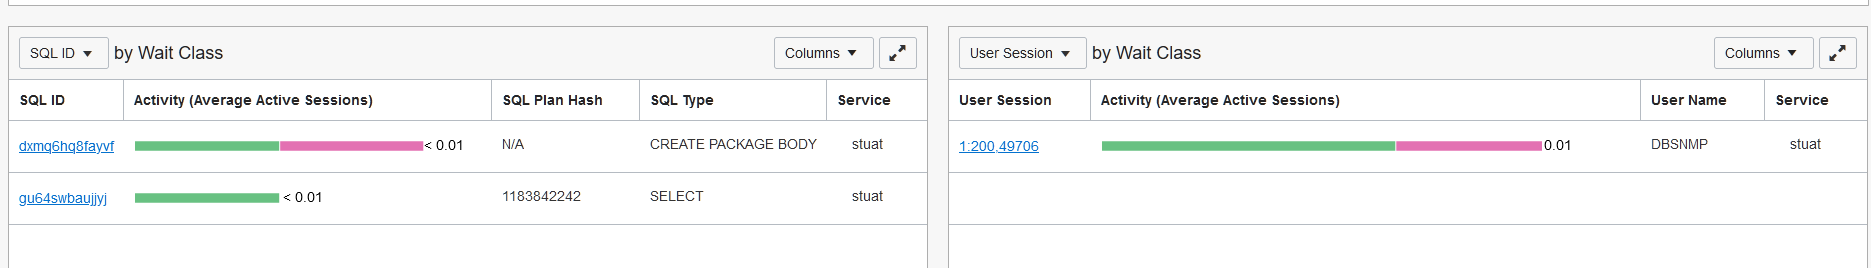
Could also view the ASH Analytics and SQL monitoring sections. This is true even when PDB service name was used for enabling (document states not available for PDBs).

If full option was selected, then there would be additional tabs such as addm and blocking sessions.

If cdb service was used during the enabling process then the SQL monitor will show both pdb and cdb related SQLs.
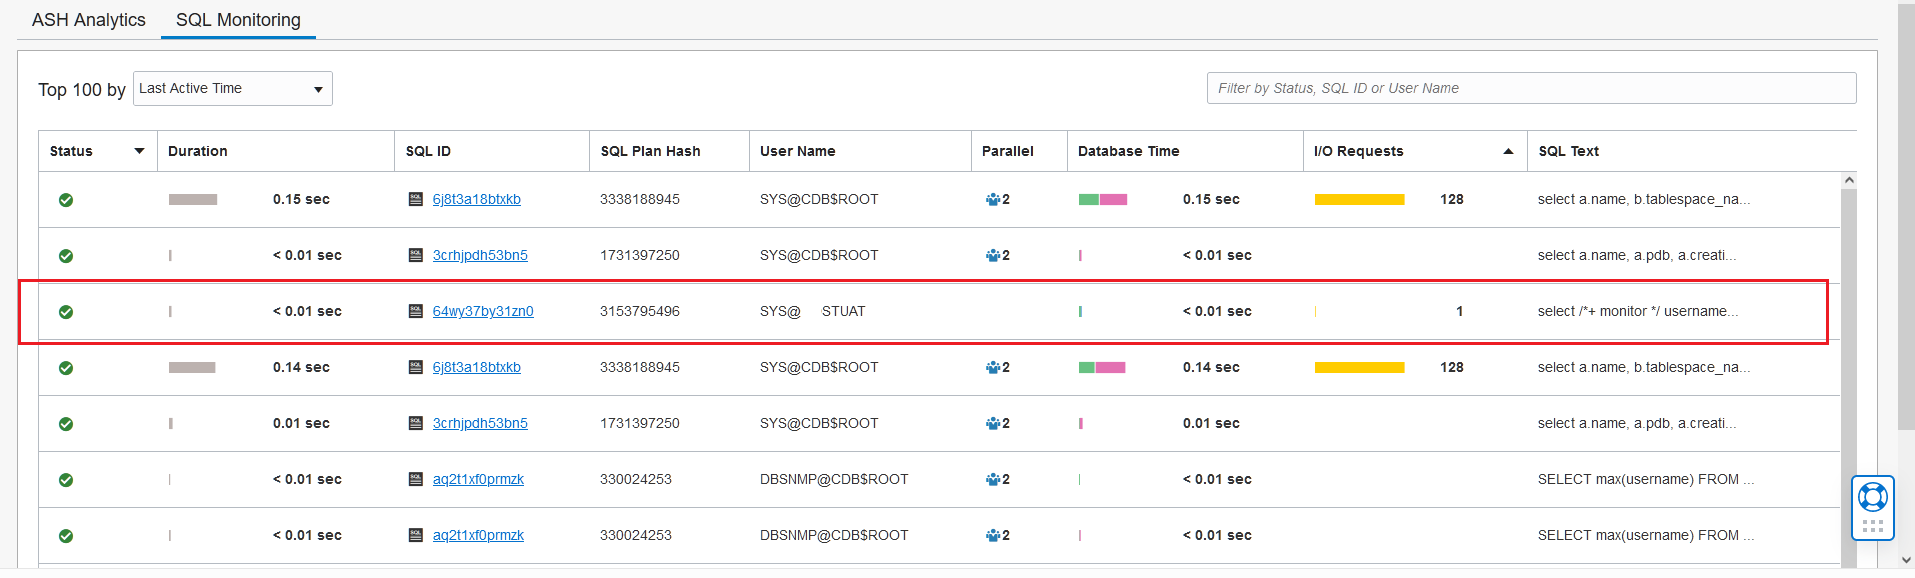
On the otherhand if PDB service name was used during enabling then only PDB related SQLs are shown.
DB management enable with basic could be later changed to full and vice versa. Also a connection to the cdb could be changed to PDB and vice versa.


With the full option additonal capabilities are enabled and could be access via Observability & Management -> Fleet Summary. Below screenshots show Fleet summary showing PDB related details (when PDB service name was used for enabling)

Below shows the fleet summary page when CDB service was used for enabling.


When CDB is viewed on the fleet summary, no PDB related information is shown. It could be this fact that the documentation states when it says "currently not available for PDBs".
As a final note, when performance hub is used, every time a monitoring SQL runs it generates an audit record if auditing policy includes "select any dictionary" (CIS audit policy requires this). Below is a sample of such audit records.
EVENT_TIMESTAMP                ACTION_NAM OBJECT_NAME      DBUSERNAME OBJECT_SCH OS_USERNAM SQL_TEXT
------------------------------ ---------- ---------------- ---------- ---------- ---------- --------------------------------------------------------------------------------
20-OCT-21 02.16.08.785885 PM   SELECT     GV_$SQL_PLAN     DBSNMP     SYS        odosvc     select /*+ opt_param('parallel_execution_enabled',
20-OCT-21 02.16.08.790501 PM   SELECT     X$KQLFXPL        DBSNMP     SYS        odosvc     SELECT /*+ opt_param('parallel_execution_enabled','false') */
20-OCT-21 02.16.08.790909 PM   SELECT     GV$SQL_PLAN      DBSNMP     SYS        odosvc     SELECT /*+ opt_param('parallel_execution_enabled','false') */
20-OCT-21 02.16.08.791373 PM   SELECT     GV_$SQL_PLAN     DBSNMP     SYS        odosvc     SELECT /*+ opt_param('parallel_execution_enabled','false') */
20-OCT-21 02.16.08.800590 PM   SELECT     X$KQLFXPL        DBSNMP     SYS        odosvc     select /*+ opt_param('parallel_execution_enabled',
This has been mentioned in a previous post as well. Take neccessary actions to avoid rapid growth of audit records due to the use of performance hub.